| Code | Date | Time | Duration | Location | Currency | Team of 10 Per Person | Team of 7 Per Person | Early Bird Fee Per Person | Normal Fee Per Person |
|---|---|---|---|---|---|---|---|---|---|
| COURSE CODE : PEA / WTER / 26 | 06 Apr 2026 | 9 PM Indian Time |
2 Hours Per Day
|
Zoom Online
|
The Classes Will be from Monday to Friday for 2 Weeks Via Zoom Online.
Boost your team's skills and your budget! Enjoy group discounts for collaborative learning. Send an inquiry to info@peassociations.com.
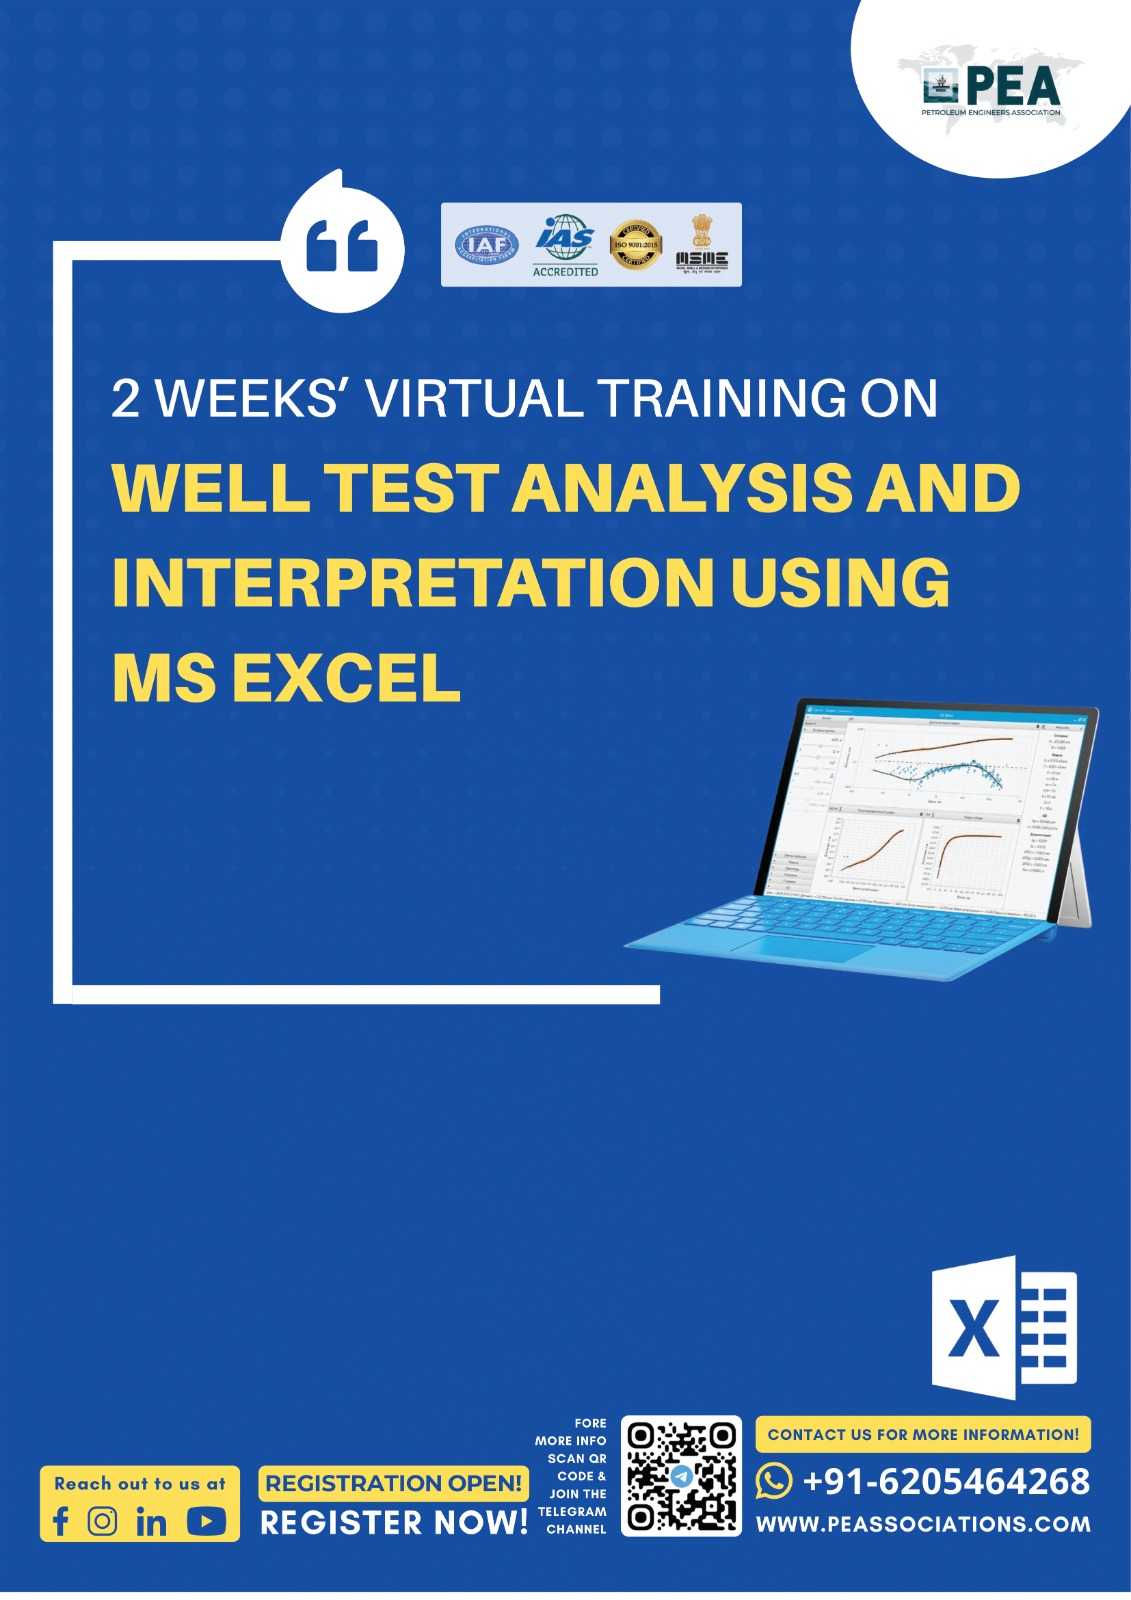
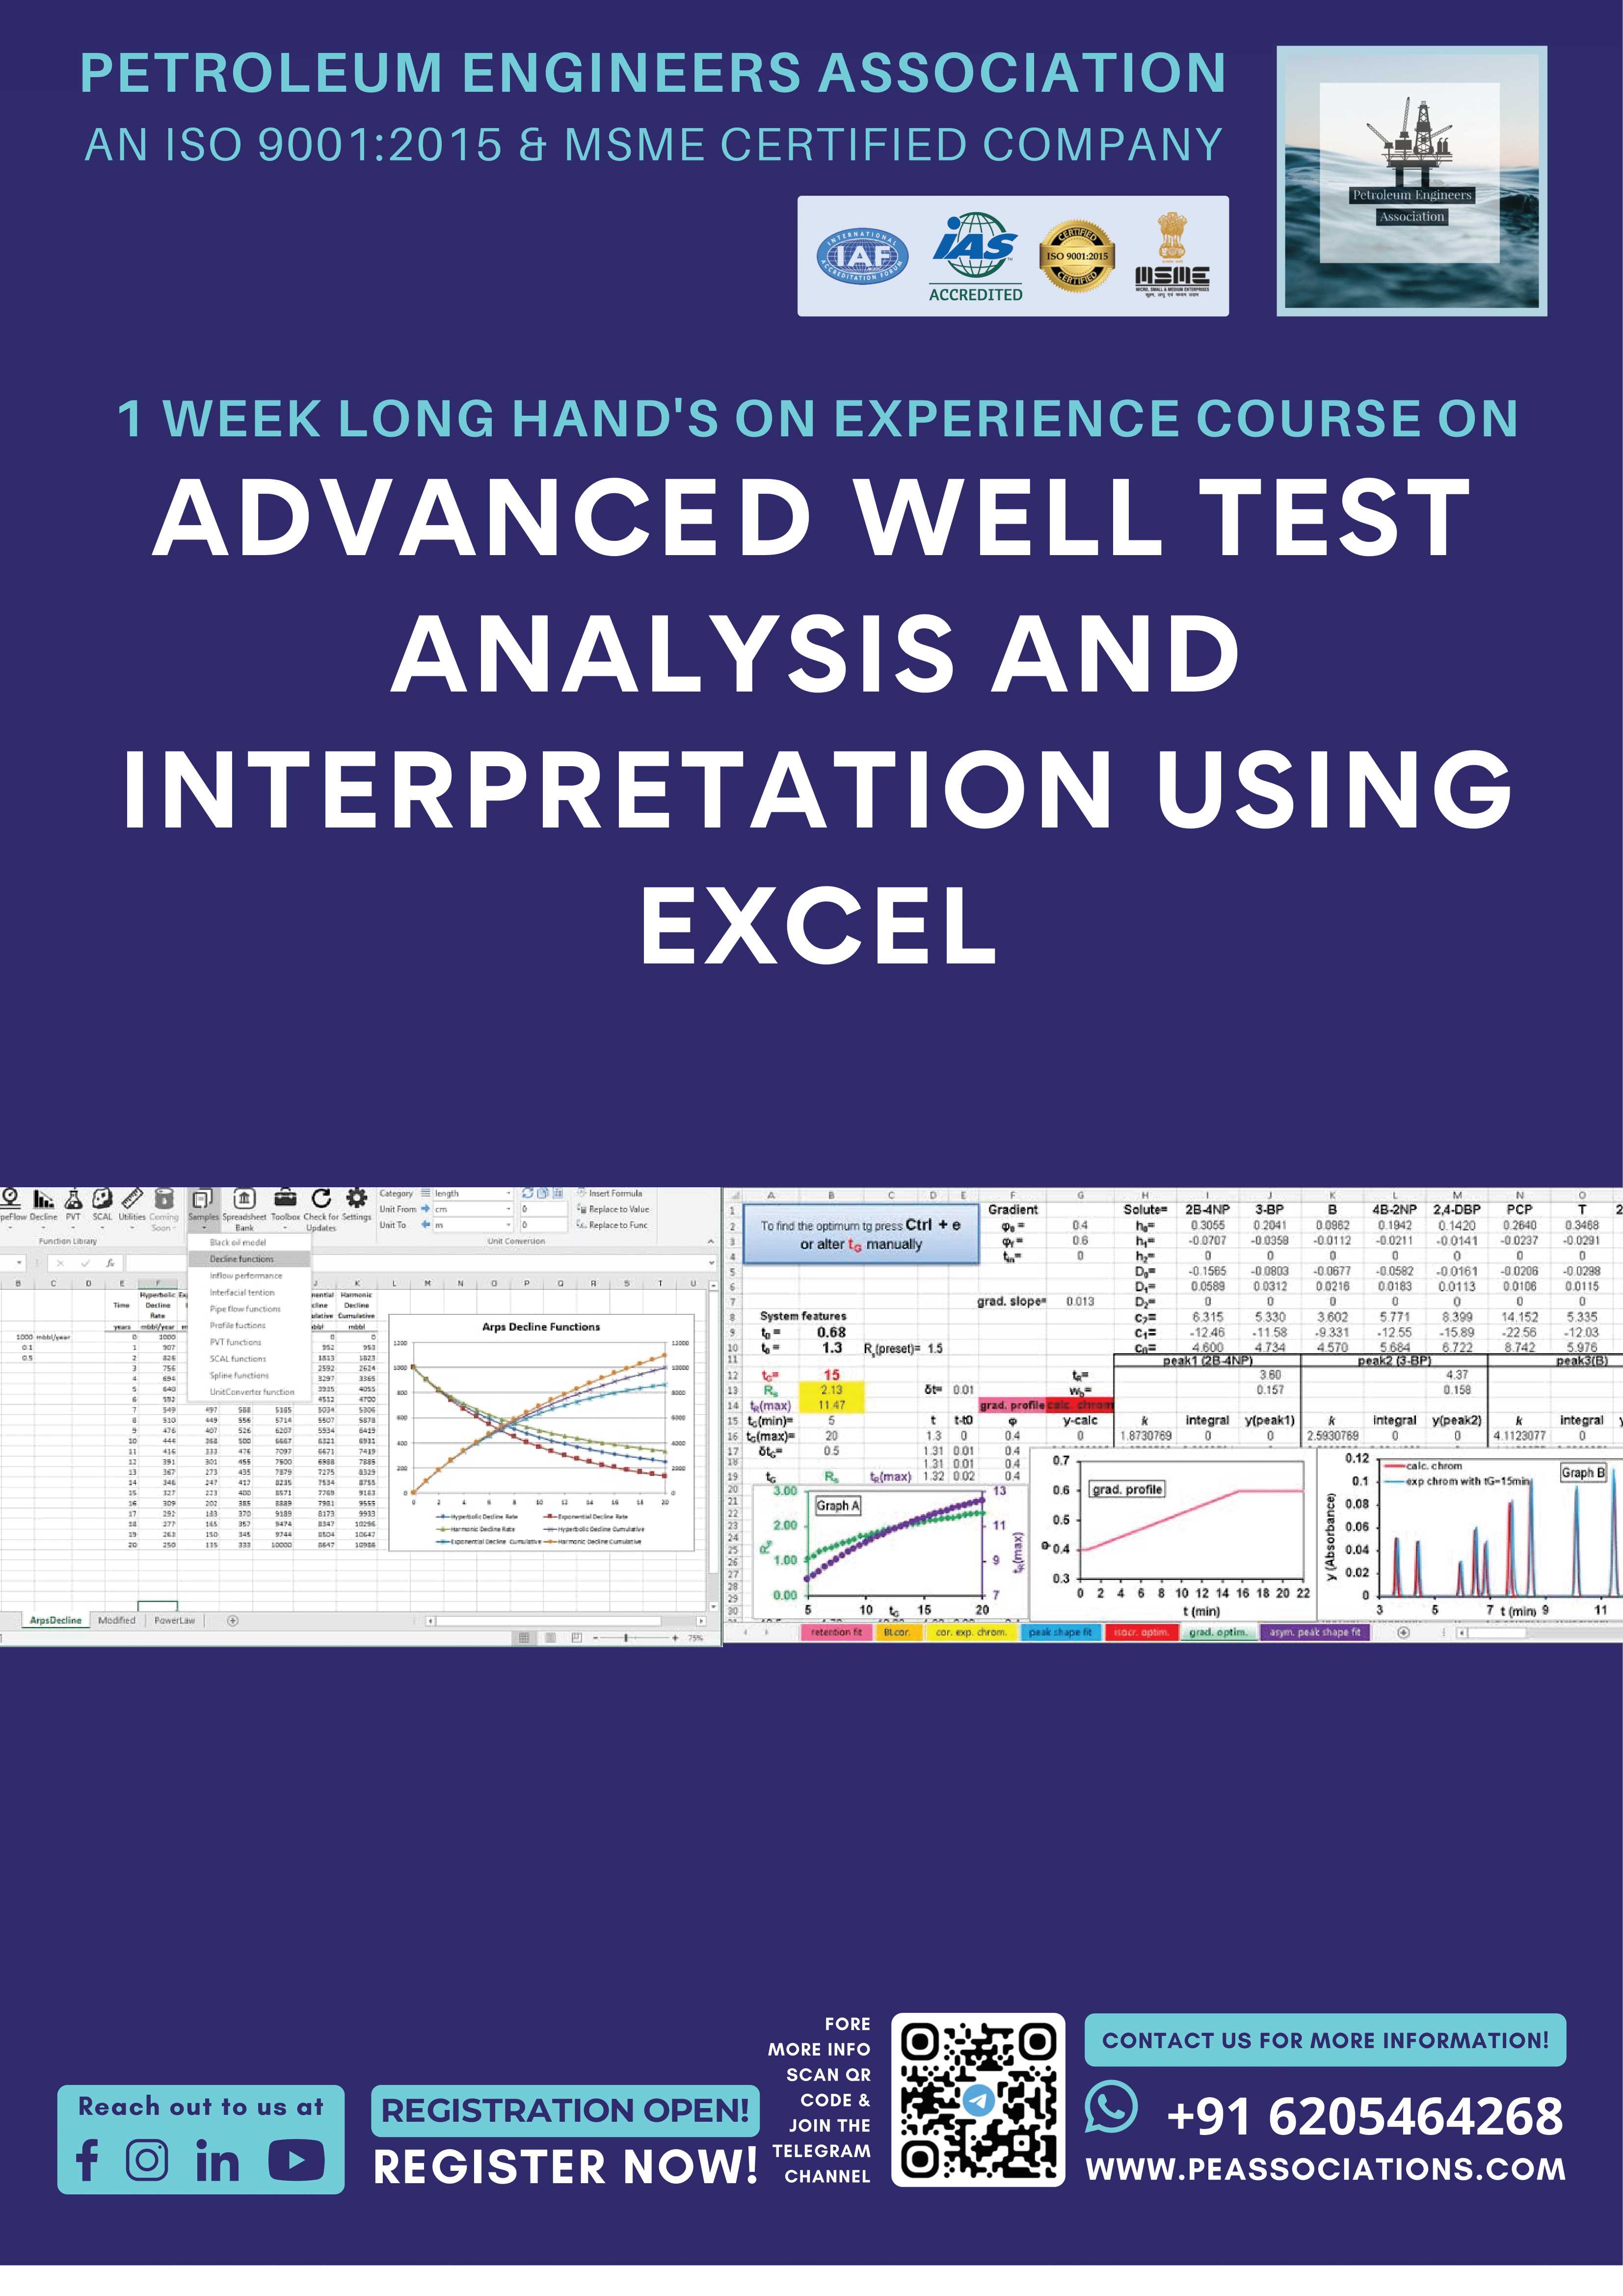
Well Test Analysis and Interpretation using MS Excel
This course provides a practical approach to analyzing and interpreting well test data using MS Excel, enabling professionals to gain insights for better decision-making in reservoir management. Designed for oil and gas engineers and data analysts, it combines theory and hands-on exercises for immediate, practical application.
Description
In "Well Test Analysis and Interpretation using MS Excel," participants will explore essential techniques to analyze, interpret, and model well test data, gaining proficiency in using MS Excel to perform calculations, create visualizations, and draw critical insights. From basic well test principles to advanced data interpretation, this course offers a complete, user-friendly approach for anyone working with reservoir data. By the end, attendees will confidently apply Excel-based analysis to support and enhance well and reservoir performance.
Well test analysis is crucial for understanding reservoir properties and making informed production decisions. This course provides a comprehensive overview of well test analysis techniques, emphasizing practical applications using MS Excel. Through interactive sessions and case studies, participants will learn to interpret well data, model production potential, and identify key reservoir characteristics.
The course employs a mix of theoretical lessons, real-world case studies, and interactive exercises. Participants will engage in hands-on tasks using MS Excel, with guidance and feedback from experienced instructors. Practical application is emphasized throughout, ensuring that attendees can directly apply what they learn to their work.
- Improved decision-making for well and reservoir management.
- Enhanced ability to identify and troubleshoot potential production issues early.
- More effective use of Excel-based tools for rapid, accurate data analysis.
- Increased operational efficiency by equipping teams with practical skills in well test analysis.
This course is ideal for petroleum engineers, reservoir engineers, production engineers, data analysts, and other professionals in the oil and gas industry involved in well testing, data analysis, or reservoir management. It’s also suitable for those who want to enhance their Excel skills for technical data interpretation.
Day 1
- Introduction to well testing
- Steady state
- Pseudo steady
- Unsteady state
- Radius of investigation
Day 2
- Inflow performance relation
- Tubing performance relation
- Gas performance relation
- Future predictions Numerical
Day 3
Principle of superposition
Effects of multiple wells
Effects of rate change
Effects of the boundary
Numerical
Day 4
Drawdown test
Horner’s plot
K & s estimation
Wellbore storage
Numerical
Day 5
Pressure build up
Reservoir parameter estimation
Productivity index
Flow efficiency
Delta P skin
Day 6
Horizontal well
Isotropic and anisotropic PI
Horizontal well IPR construction
Numerical
Day 7
DST Parameter interpretations
Pattern interpretations
Introduction to pressure derivatives
Numerical
Day 8
Interference test
Directional permeability
Type curve
Numerical
Day 9
Step rate injectivity
Fracture pressure determination
Type curve
Numerical
Day 10
Pulse testing
Lag time
Pulse ration
Even and odd pulse
Numerical
On successful completion of this training course, PEA Certificate will be awarded to the delegates
Dr. M. Prince with over 13 years of experience in academia and industry. He have a PhD in Engineering and Technology, an MBA in HR & IT, and an M.Tech in Petroleum Exploration. His research interests lie in Enhanced Oil Recovery (EOR) and have published 41 papers, 19 of which are in Scopus/WOS. He has also worked as an international instructor for engineering and management programs.


