


Boost your team's skills and your budget! Enjoy group discounts for collaborative learning. Send an inquiry to info@peassociations.com.
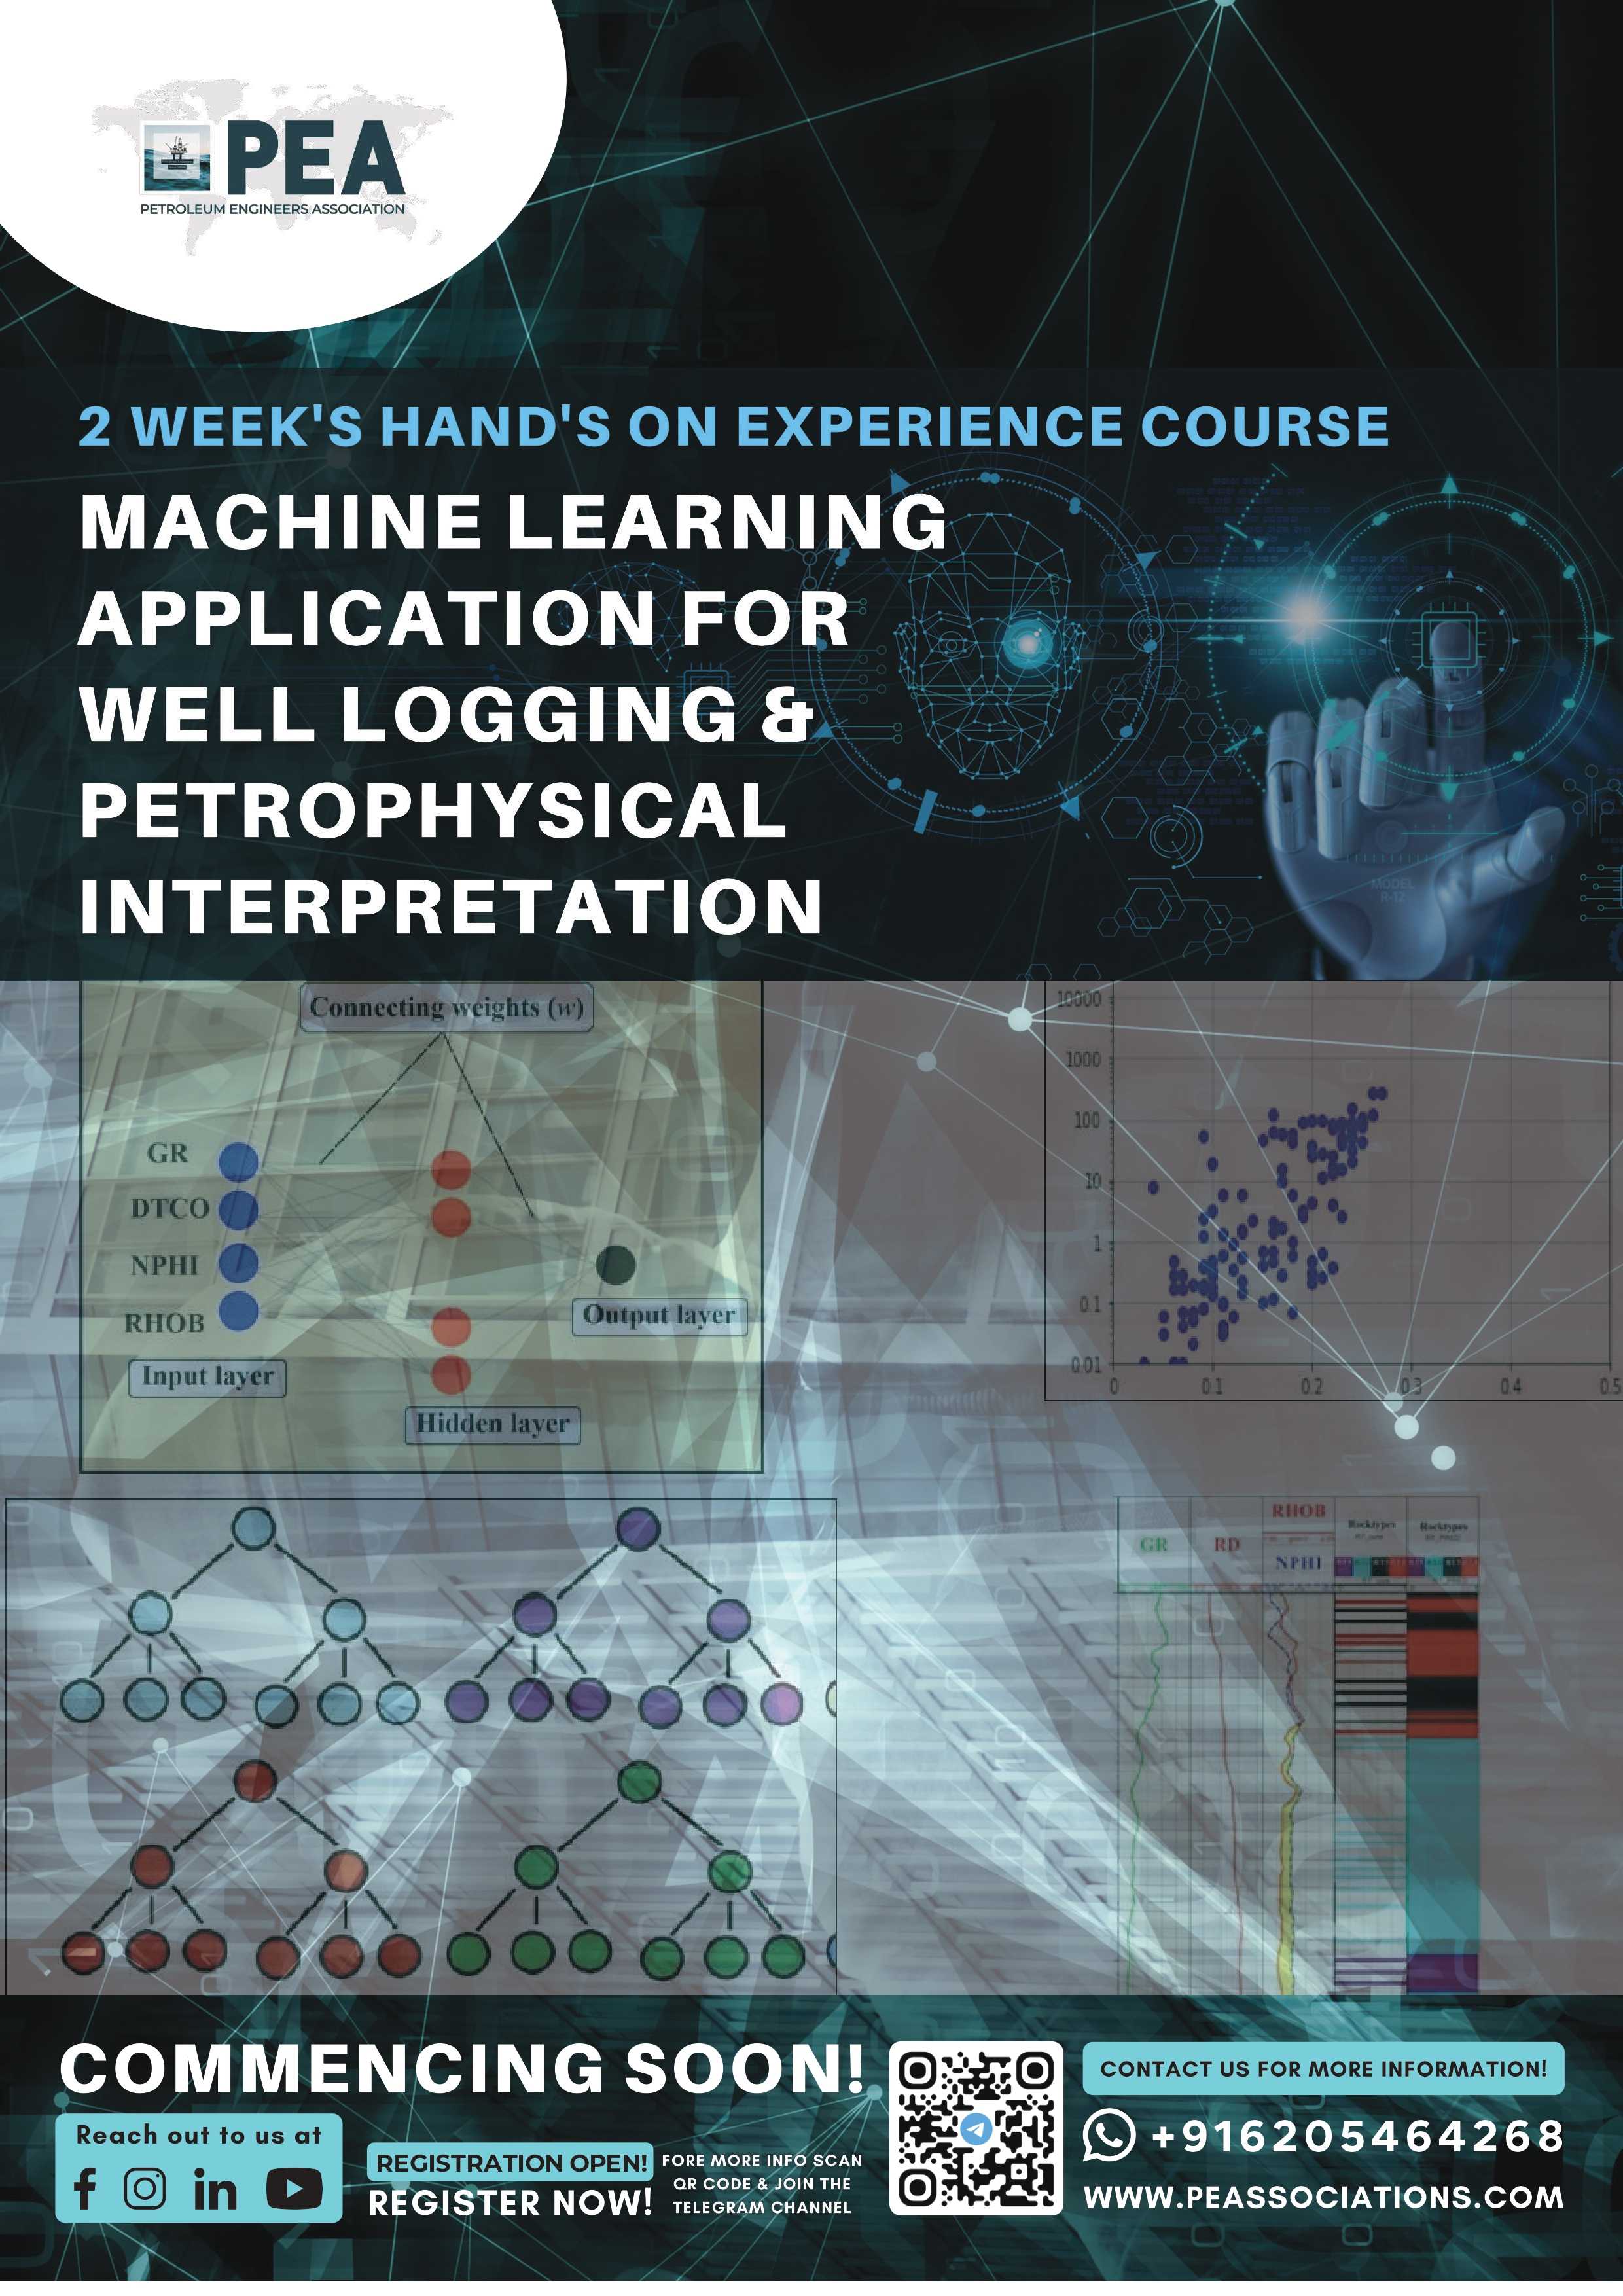
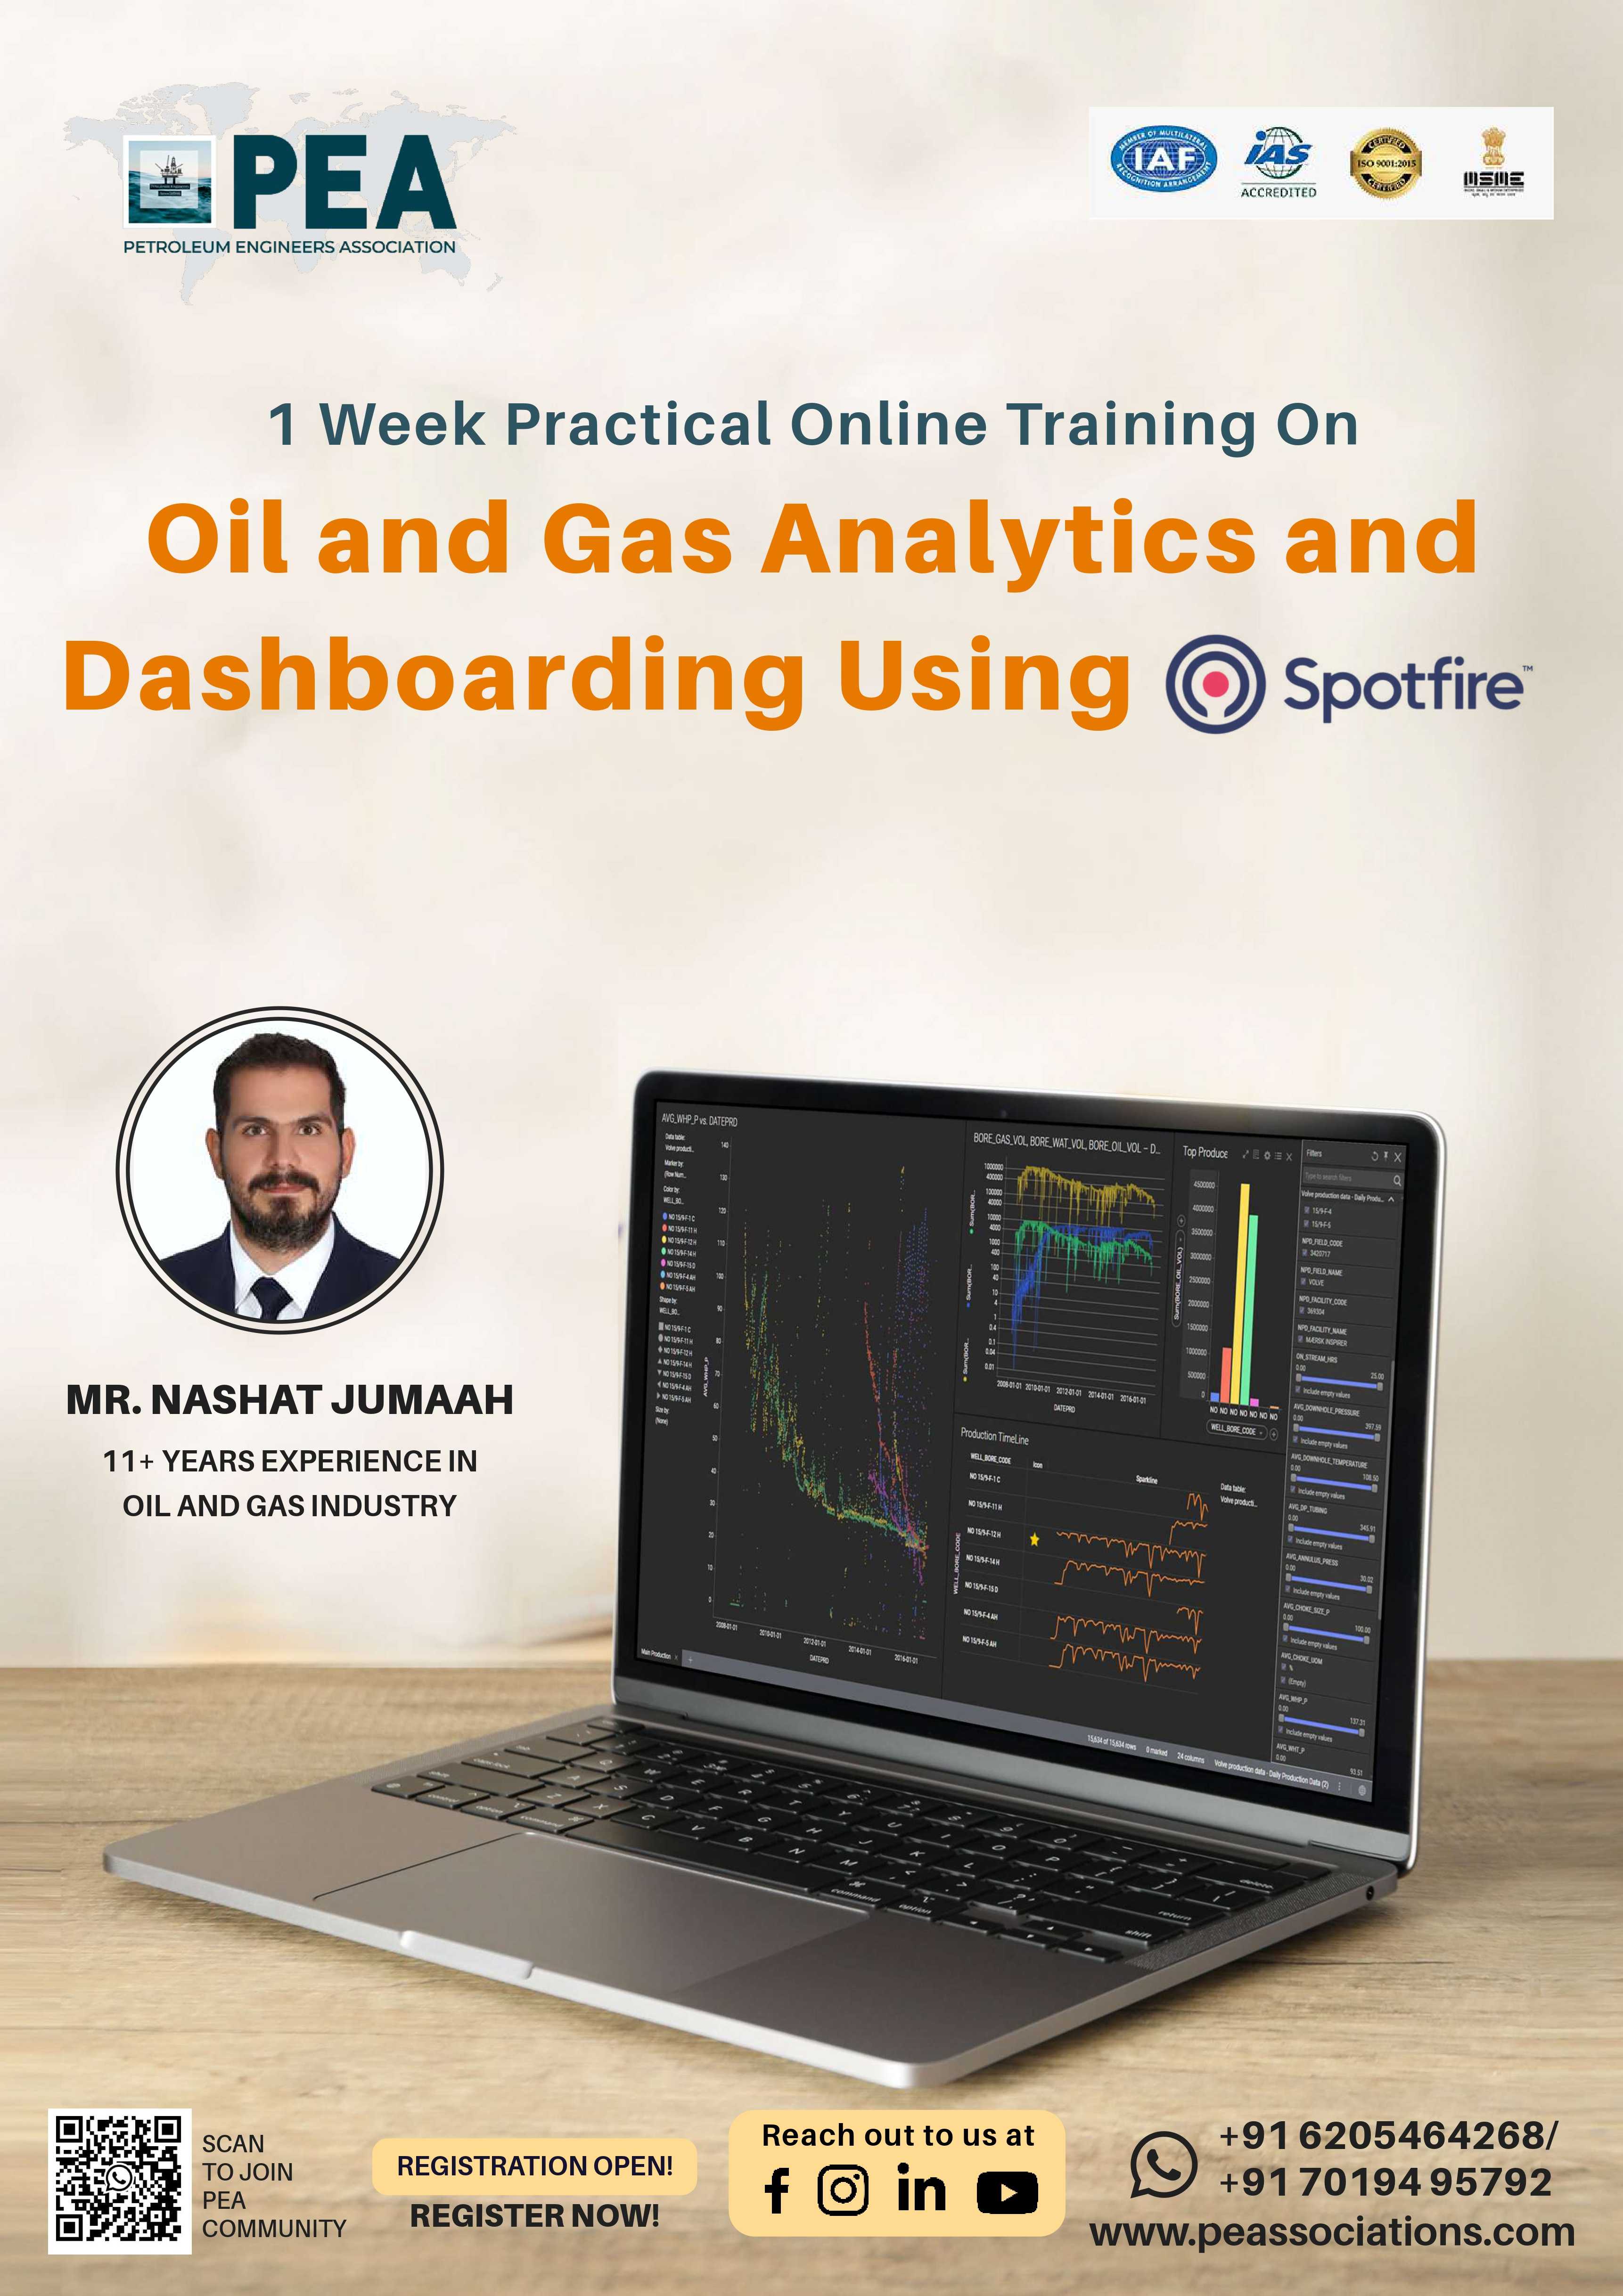
Oil and Gas Analytics and Dashboarding Using Spotfire
This course provides participants with the skills to use Spotfire for advanced data analytics and dashboarding in the oil and gas industry. Learn how to effectively visualize complex datasets, create interactive dashboards, and leverage data-driven insights to optimize performance and decision-making.
Description
In the rapidly evolving oil and gas industry, data-driven insights are critical for staying ahead. This course equips professionals with hands-on experience in using Spotfire for advanced analytics and dashboarding. Participants will learn to process, analyze, and visualize large datasets, allowing for better operational and strategic decisions. Whether it's production monitoring, reservoir management, or financial reporting, Spotfire enables you to create custom dashboards and gain real-time insights that drive results. The course covers data integration, workflow optimization, and interactive visualizations, tailored to meet the industry's unique demands.
As oil and gas operations become more data-intensive, the ability to analyze and visualize data effectively is a game-changer. This course offers comprehensive training on how to use Spotfire for oil and gas analytics, helping professionals turn raw data into actionable insights. By the end of the course, participants will be equipped with the tools to build dynamic dashboards and make data-backed decisions, improving both operational efficiency and business outcomes.
This course uses a combination of instructor-led lectures, hands-on exercises, real-world case studies, and interactive sessions. Participants will have access to sample datasets from the oil and gas industry and will develop their dashboards step-by-step under expert guidance.
This course is ideal for professionals in the oil and gas industry, including:
- Data Analysts and Engineers
- Reservoir and Production Engineers
- Operations Managers
- Business Intelligence Analysts
- Financial Analysts
- Anyone looking to enhance their skills in data analytics and visualization using Spotfire.
Module 1
Introduction to Spotfire
Spotfire Working Environments.
Introduction to the Basics of Spotfire
Basics of Data Loading and Views in Spotfire
Simple Plotting In Spotfire
Module 2
Line and Scatter Plots.
Creating Trends for Scatter Plots.
Formulating Plots and Visuals for Interactive Analysis
Introduction to Filtering Pane
Multi Criteria Filtering(By Well, Reservoir, Operator)
Simple Oil and Gas Field XY Mapping
Basics of Data Modeling Theory
Relationships between oil and gas data
Working With Multisource data.
Data Manipulation and Transformation.
Advanced Data Loading.
Data View and Calculated Columns
Module 3
Cross Filtering.
Creating Interactive Dashboards.
Enhancing UX through Advanced Formatting Visuals and Tools
Introduction to bars, stacked bars.
Heat map.
Creating KPI metrics and Gauges for oil Field Parameters.
Introduction to Machine Learning Algorithms
Clustering Wells in Spotfire
Machine Learning Tasks in Spotfire
Module 4
Introduction to Data Functions using Python
Creating Calculated Columns
Understanding How Filters Work
Basics of Python for Spotify.
Installing additional Python libraries
Working with Python
Tabular Data Generation and Calculation
Custom Python Visualization in Spotfire
Module 5
Satellite mapping for Oil and Gas fields.
Heat maps and Other Chart types.
Multi-Axis Plotting
Introduction to Python for Spotfire.
Direct Query and SQL databases.
Mini Plotting - Trelli Plottings
Science behind Visuals
Storytelling with Visuals
On successful completion of this training course, PEA Certificate will be awarded to the delegates
Our Most Popular Courses