| Code | Date | Time | Duration | Location | Currency | Team of 10 Per Person | Team of 7 Per Person | Early Bird Fee Per Person | Normal Fee Per Person |
|---|---|---|---|---|---|---|---|---|---|
| COURSE CODE : PEA / PYREP / 26 | 02 Mar 2026 | 9 PM Indian Time |
2 Hours Per Day
|
Zoom Online
|
The Classes Will be from Monday to Friday Via Zoom Online.
Boost your team's skills and your budget! Enjoy group discounts for collaborative learning. Send an inquiry to info@peassociations.com.
Practical Reservoir Engineering Methods Using Python
Learn practical reservoir engineering methods with Python through real-world applications, equipping participants with essential skills to enhance reservoir performance and optimize recovery.
Description
Our "Practical Reservoir Engineering Methods Using Python" course offers a unique blend of theory and practical application, focusing on using Python to solve common challenges in reservoir engineering. Participants will explore industry-standard methods for evaluating reservoir performance and optimizing production, all while gaining hands-on experience in data analysis and simulation. This course is ideal for engineers seeking to integrate data-driven methods into their reservoir management practices
Reservoir engineering is increasingly data-intensive, requiring engineers to leverage the power of modern computing for effective decision-making. This course is designed to help participants utilize Python programming to implement critical reservoir engineering techniques. With practical examples and expert guidance, attendees will learn how Python can streamline data analysis, improve accuracy, and ultimately enhance reservoir performance.
The course combines lectures, hands-on coding exercises, case studies, and collaborative problem-solving. Participants will work with real-world datasets and practical examples to reinforce their understanding, with guidance from experienced instructors to ensure skill application beyond the classroom.
Reservoir Engineers.
Production engineers.
Chemical engineers.
Drilling engineers.
Geologists and
petrophysics
AL and workover
engineers.
Day 1
Why Reservoir Engineers Should Use Python
Python Data as Related to Oil and Gas Industry
Data types and Structures in Python
Introduction to Data Visualization
Working with Tabulated Data using Pandas
Basics of Data Cleaning and Transformation using Pandas.
Creating Calculations and Data Exports.
Linking Excel, CSV, TXT to Python
Exercises
Oil and Gas Data Reading and excel connection to python
Simple Reservoir Data Visualization.
Filtering Reservoir Data based on Wells (single or Multiple)
Cleaning and organizing historical data, with proper date time
conversion.
Day 2
Visualization in
depth.
Introduction
to Delauny Triangular Maps
Introduction to Interactive Dashboards
What is Metrics and KPI and How to visually display them
More on visualization.
Detecting undeveloped reservoir areas by using base map with
drainage bubbles.
Subsurface Contour Mapping
Interactive Reservoir Data Dashboards.
Interactive Well Selection and Dynamic Data Filtering.
Cumulative Production Calculation
Bubble Map for Well Drainage Extent
Day 3
Introduction to Time
Series Analysis using Auto Regression
Introduction
to Water Cut Production
Selection based Water Cut Analysis and WOR prediction.
Introduction to Chan Plot for Water Oil Ratio Diagnostics
Flowing Material
balance and Linear fitting.
Linear and Non-Linear
curve fitting and coefficient calculation.
Linear Production
Forecasting
Exercises
Chan Plot for Water Flooded reservoirs.
Using Auto Regression for Non empirical time series prediction
(WOR, GOR, etc.).
X Plot
Flowing Material balance and Recover estimation.
Day 4
Reservoir Tank
Modeling connection with Python
Controlling Tank Model
using Python code.
Production Schedule
Control
Well Performance
evaluation based on numerical simulation
Reservoir PVT property
calculation and tabular reporting and plotting using python
Exercises
Connect MBAL software to Python.
Do a 1d simulation and control the simulation using python
PVT property calculation
Day 5
Introduction to NumPy
Introduction Random
data Class
Introduction to
Statistical Distribution
Introduction to Pareto
principle and opportunity identification.
Introduction to
Control Chart and Well performance classification.
Introduction to Monte
Carlo simulation.
Interactive Monte
Carlo simulation and controlling the histogram
Reservoir Data
Aggregation.
Production Data
Aggregation (Yearly, Monthly).
Exercises
Pareto Well Analysis 80/20 rule.
Create Reservoir Data Distribution
Monte Carlo simulation on IOIP.
Creating Histograms.
Statistical Well Performance Evaluation using Control Chart.
On successful completion of this training course, PEA Certificate will be awarded to the delegates.

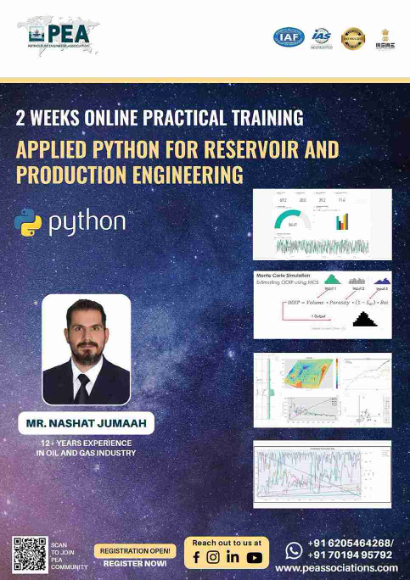
Mr. Nashat J. Omar With over 11 years of specialized experience in petroleum engineering, focus on production and flow assurance brings valuable expertise to the energy sector.
He possess a strong command of Python and C#, which empowers him to create efficient data management solutions and streamline workflows.
His collaborative nature and adaptability enable him to thrive in multidisciplinary settings, where he consistently contributes to success through innovative problem-solving.
He is dedicated to continuous learning and staying ahead of industry advancements, ensuring that he can enhance operational efficiency and guarantee robust flow assurance.

