| Code | Date | Time | Duration | Location | Currency | Team of 10 Per Person | Team of 7 Per Person | Early Bird Fee Per Person | Normal Fee Per Person |
|---|---|---|---|---|---|---|---|---|---|
| PYREPRO25 | 25 Aug - 07 Sep 2025 | 9 PM Indian Time |
2 Hours Per Day
|
Zoom Online
|
USD
|
650
|
700
|
850
|
1500
|
Classes Will be from Monday to Friday Only (Sat & Sun off)
Boost your team's skills and your budget! Enjoy group discounts for collaborative learning. Send an inquiry to info@peassociations.com.
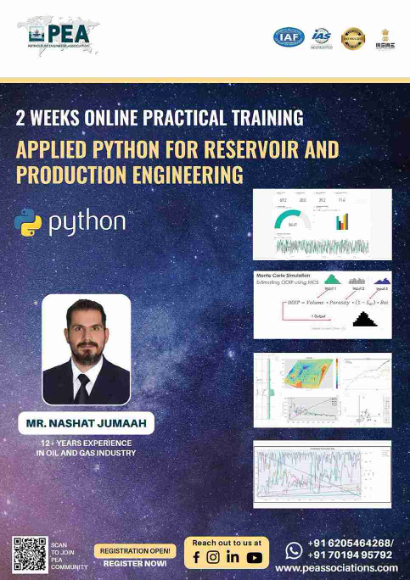
Applied Python for Reservoir & Production Engineering
Empower your engineering career with practical Python skills. This hands-on training equips you to analyze data, optimize production, and make informed decisions using Python.
Description
This intensive training program is designed for reservoir and production engineers seeking to leverage the power of Python for data analysis, visualization, and modeling. Through expert-led instruction and hands-on exercises, you will master essential Python skills and apply them to real-world engineering challenges.
This intensive training program equips reservoir and production engineers with the practical Python skills needed to analyze data, optimize production, and make informed decisions. Gain hands-on experience applying Python to real-world engineering challenges.
Learn fundamental Python programming concepts relevant to reservoir and production engineering
Master data analysis and visualization techniques using Python libraries
Apply Python to reservoir modeling, production optimization, and well performance analysis
Develop practical skills through hands-on exercises and projects
Expert-led instruction with a focus on practical application
Interactive sessions with ample opportunities for Q&A
Hands-on exercises and projects using real-world data
Collaborative learning environment
Enhance engineering team's capabilities and efficiency
Improve decision-making through data-driven insights
Optimize reservoir and production performance
Drive innovation and cost savings
Gain valuable, in-demand skills
Boost your career prospects
Expand your professional network
Stay ahead in the rapidly evolving energy industry
Reservoir and Production Engineers
Petroleum Engineers
Geoscientists
Data Scientists and Analysts in Energy
Python for Production Module
Day 1
Introduction to Python basics
Python IDEs and available tools
Python Data Structures
Loops and Branching.
Introduction to Tabular data Using pandas
Project 1: Calculating Production Parameters from Tabular Data using Pandas
Day 2
Introduction to Plotting Using Matplotlib
Introduction to plotting using Plotly
Project 2: Calculating, Visualizing, Exporting Fluid Properties.
Project 3: Calculating the Heterogeneity index for Oil Wells.
Introduction to Lasio library for Well Log files.
Day 3
Project 4: Well Log Interpretation and Visualization using Python
Introduction to IPM PVTp OpenServer Commands
Introduction to IPM MBAL OpenServer Commands
Project 5: Controlling IPM package using DO, SET, GET and Python
Day 4
Introduction to Streamlit dashboarding and the visual components
Introduction to Curve Fitting.
Project 6: Water Production Diagnostics via Chan Plot.
Project 7: Grid, and heat Mapping for Reservoir Production and Petrophysical Properties.
Day 5
More on data Manipulation and Advanced pandas.
Introduction to Statistics and Distribution
Introduction to fast Dashboarding using Gradio.
Project 8: Carlo Simulation and Histograms for OOIP
Python for Reservoir Engineering and Surveillance Module
Day 6
Introduction to Python basics
Python IDEs and available tools
Python libraries and PIP command
Use Case 1: Inflow Performance Relationship
Introduction to plotting
Use Case 2: Create Interactive Production Plots
Day 7
Handling tabular data using Pandas
Using Plotly for Interactive data visualization
Use Case 3 : Create a Composite Production Plot with Multiple Y Axis
Liquid Loading Calculation in Python.
Use Case 4: Turner’s & Colman’s Rate for Gas Well Diagnostics
Day 8
Python automation and Integration
Introduction to PETEX GAP.
Introduction to GAP API.
DO, SET, GET commands in GAP and Open Server Integration with Python
Use Case 5: Connecting GAP to Python for various tasks.
Day 9
Introduction to Dashboarding with Streamlit
Use Case 6: Create a Production Dashboard for Oil and Gas Fields
Introduction to Well Integrity and Barlow Equation.
Introduction to Lasio library for Well Log files.
Use Case 7: Calculated MAOP from MultiFinder logs(MFC)
Day 10
Use Case 8 : Converting WHP to BHP using Beggs and Brill Correlation
Use Case 9 : Operational Data Smoothing using various Filters and AVG algorithms
Use Case 10: Automated Decline curve analysis (Time-Rate)
On successful completion of this training course, PEA Certificate will be awarded to the delegates

Mr. Nashat J. Omar With over 11 years of specialized experience in petroleum engineering, focus on production and flow assurance brings valuable expertise to the energy sector. He possess a strong command of Python and C#, which empowers him to create efficient data management solutions and streamline workflows. His collaborative nature and adaptability enable him to thrive in multidisciplinary settings, where he consistently contribute to success through innovative problem-solving. He is dedicated to continuous learning and staying ahead of industry advancements, ensuring that he can enhance operational efficiency and guarantee robust flow assurance.

