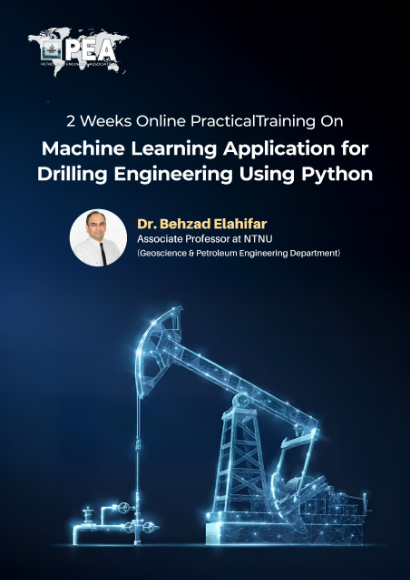

32-Hour Intensive Practical Mastery Program
Python For Oil & Gas
Empower Your Technical Skills with Python for Efficient, Data-Driven Solutions in Oil and Gas

Secure your spot now!


Python For Oil & Gas
Have Questions ?
Python For Oil & Gas - POG26
| Code | Date | Time | Duration | Location | Currency | Team of 10 Per Person | Team of 7 Per Person | Early Bird Fee Per Person | Normal Fee Per Person |
|---|---|---|---|---|---|---|---|---|---|
| POG26 | 05 Sep - 25 Oct 2026 | 11 AM CDT |
2 Hours / Day
|
Zoom Online
|
USD
|
1150
|
1250
|
1500
|
2500
|
The Classes Will be Only On Sat & Sun Via Zoom Online for 8 Weeks.
Boost your team's skills and your budget! Enjoy group discounts for collaborative learning. Send an inquiry to info@peassociations.com.
What Our Professionals Say
Verified reviews from professionals who completed this course
5.0
“It is a useful and practical course and Python's versatility and powerful libraries have made it essential in reservoir and production engineering, streamlining data handling, visualization, modeling, and automation.”

“Though coding isn't part of my daily role, this course gave me a deeper understanding of data analysis and its value to our industry. Big thanks to Nashat Jumaah Omar for an engaging and practical learning experience through real-life case studies an”

“Glad to complete the Python for Oil & Gas training by PEA. Thanks to Mr. Nashat Jumaah Omar for the practical and insightful sessions. Excited to apply these skills and highly recommend their upcoming Machine Learning course!”

“Completed the Python for Oil & Gas course by PEA - a great learning experience that strengthened my coding skills for real-world engineering tasks. Big thanks to Nashat Jumaah Omar and the PEA team. Highly recommend it to anyone in oil & gas!”

“Big thanks to Nikhil Agarwal and the team for organizing this well-run course! Special appreciation to Nashat Jumaah Omar for delivering the training so clearly and effectively - every session was truly valuable.”

“I'm grateful for the PyQuant News and #PEA courses, which have set me on the right learning path. I'm particularly interested in Commodities and Energy Markets.”

Python For Oil & Gas
Description
Demo Class
The oil and gas industry is increasingly data-driven, and Python is a powerful tool for unlocking the insights hidden within complex datasets. This course is crafted specifically for professionals in the sector, providing them with the tools to automate tasks, analyze data more effectively, and make informed, data-driven decisions. With practical exercises and industry-focused examples, participants will gain the confidence to implement Python into their daily workflows.
Master Python fundamentals with a focus on industry-relevant applications.
Build robust data analysis and visualization skills tailored for oil and gas.
Learn automation techniques to enhance operational efficiency.
Develop advanced skills in data interpretation and reporting.
Apply Python to real-world oil and gas projects, improving decision-making.
This hands-on course includes interactive lectures, practical coding exercises, and project-based learning. Through real-life industry examples, participants will understand how to apply Python effectively to typical oil and gas scenarios.
Enhanced Productivity: Streamline complex tasks, reducing time and resources.
Informed Decision-Making: Leverage data insights to support critical operational decisions.
Increased Efficiency: Automate repetitive tasks, improving workflow and reducing manual errors.
Competitive Advantage: Equip teams with cutting-edge Python skills, staying ahead in a rapidly evolving industry.
Skill Development: Gain confidence in using Python for essential industry tasks.
Improved Problem-Solving: Apply data science techniques to real challenges.
Enhanced Career Opportunities: Strengthen your technical skills, adding a valuable asset to your professional profile.
Increased Efficiency: Improve your day-to-day productivity with practical coding skills.
Reservoir Engineers.
Production engineers.
Chemical engineers.
Drilling engineers.
Geologists and petrophysics
AL and workover engineer
Undergraduate students.
Module 1: (Day 1 & 2)
Installing Anaconda Python & Packages
Introduction to Anaconda & Software Packs
Introduction to Python & Why Python?
Basics Expressions in Python
Variables and Data Types
Sequences in Python (List, Tuple, Set, Dictionary)
Simple Plot with Matplotlib
Inflow Performance Example
Module 2: (Day 3 & 4)
More on Sequences
Programming (For and While loops)
Integrated If Statements and Loops (including break, continue)
Introduction to Python Function (def keyword)
Recovery Factor Example (Guthrie Corr.)
A PVT Example
Exporting Plots
Exporting Calculation Results to Excel
Module 3: (Day 5 & 6)
Introduction to Pandas
Reading Tabulated Data & Excel Sheets
Historical Data Plotting
Introduction to JupyterLab
Plotting with Plotly Express
Liquid Loading Example (Turner's Rate)
Chan Plot Diagnostic (with Polynomial Regression)
Basic Matplotlib Figure Configurations
Polynomial Fitting Using Numpy
Module 4: (Day 7 & 8)
Introduction to Matplotlib 2D Surface Mapping
Contour Plots and its Variants in Python
Oil Field Formation Depth Mapping Example
Water Oil Contact 3D Mapping
Data Averaging Techniques (utilizing Oil Production and WHP)
Working with Las Files and Well Logs using Lasio
Module 5: (Day 9 & 10)
Introduction to Plotly Configuration
Plotly Subplots
Introduction to Sankey Charts
Production Back Allocation Example
Creating Well and Separator Networks Visuals
Introduction to Two-Phase/Multiphase Flow Package (psapy)
Prediction of BHP using Beggs and Brill
Module 6: (Day 11 & 12)
Introduction to Flow Mapping using Fluids Package
Multivariate Scatter Coloring and Symbol Setup
Flow Stability Advisor Example
NORSOK M-506 Corrosion Monitoring Example
Reading OLGA Trend Plots using Pyfas
Introduction to Dashboarding
Working With Streamlit
Module 7: (Day 13 & 14)
Creating Nodal Analysis Dashboard
Historical Production Data Dashboard
Recreating a PVT Calculator using Dashboards
Working with DCA (Simple Time-Rate Solution)
Module 8: (Day 15 & 16)
Introduction to Object Oriented Python
Producing Clean Code & Maintenance/Refactoring Tips
Introduction to Machine Learning
Data Shaping and Normalization
Training Testing Split
Regressions and Output Prediction
Classification Problems with Machine Learning
Creating Production Prediction using ML
Multivariate Regression
On successful completion of this training course, PEA Verified Certificate will be awarded to the delegates With Credential URL.
Mr. Nashat J. Omar With over 12+ years of specialized experience in petroleum engineering, focus on production and flow assurance brings valuable expertise to the energy sector.
He possess a strong command of Python and C#, which empowers him to create efficient data management solutions and streamline workflows.
His collaborative nature and adaptability enable him to thrive in multidisciplinary settings, where he consistently contributes to success through innovative problem-solving.
He is dedicated to continuous learning and staying ahead of industry advancements, ensuring that he can enhance operational efficiency and guarantee robust flow assurance.
"A comprehensive course that takes you from the ground up to mastering Python for complex oil and gas applications. Many thanks to the Petroleum Engineers Association for this opportunity." – Reservoir Engineer at SLB
"Grateful for the chance to significantly enhance my programming skills and explore advanced data visualization techniques. Big thanks for the support along the way!" – Lead Reservoir Engineer at LUKOIL
"I enjoyed the opportunity to level up my skills and learn new, powerful ways to visualize industry data. Thank you for facilitating this high-level course!" – Reservoir Engineer at PETRONAS
"Glad to complete the Python for Oil & Gas training. These were practical and insightful sessions that really bridge the gap for engineers. Highly recommend the upcoming Machine Learning course!" – Reservoir Simulation Unit Supervisor at Saudi Aramco
"It's all worthwhile to master this new skill. As the industry transitions to digitalization, these Python scripts are becoming essential tools." – Petroleum Engineer at Halliburton
"Appreciative of the opportunity to advance my programming skills and dive into innovative data visualization methods. A big shoutout for the invaluable support throughout the journey!" – Petroleum Engineer at OXY
"The capability of Python in solving practical problems is interesting. I applaud the ingenuity of the PEA team in developing these oil and gas resource libraries." – Lead Production Engineer at Shell
"It was a major goal to be able to write professional Python scripts, and I'm happy to have accomplished this through such a great training program." – Production Technologist at Petroleum Development Oman (PDO)
"Unlike general programming courses, this is industry-specific and highly practical. I am very thankful for such an amazing learning opportunity." – Petroleum Engineer at ADNOC
"Utilizing specialized libraries during the 32-hour training session was amazing. PEA provides the perfect environment for engineers to level up." – Lead Production Engineer at Total Energies
"This course gave me a deeper understanding of data analysis and its immense value to our industry through real-life case studies." – Petroleum Engineer at Baker Hughes
"Completed the Python for Oil & Gas course—a great learning experience that strengthened my coding skills for real-world engineering tasks. Highly recommend it!" – Subsurface Manager at Eni
"I would like to express my sincere gratitude to the PEA team for the continuous guidance and support provided during this intensive training." – Financial Analyst at Qatar Energy
"Python's versatility and powerful libraries have made it essential in reservoir and production engineering for streamlining modeling and automation." – Post-Doctoral Research Fellow at University of Adelaide
"Excited to complete the Python for Reservoir Engineering & Surveillance course! Gained valuable skills to optimize workflows and support smarter decisions." – Reservoir Engineer at Ecopetrol
"Special appreciation for delivering the training so clearly and effectively—every session was truly valuable. It was a pleasure learning with this team!" – Petroleum Engineer at Cairn
"I'm happy to share that I've obtained a new certification: Python Programming for Oil & Gas. I enjoyed the opportunity to level up my skills." – Petroleum Engineer at Pertamina
"I'm grateful for the PEA courses, which have set me on the right learning path with excellent weekend coaching." – Financial Analyst at Adani
"Grateful for the opportunity; I am now ready to apply these insights and drive innovation in our reservoir management." – Reservoir Engineer at Oando
"Obtained my certification in Python Programming for Oil & Gas. A fantastic opportunity to learn new, useful ways to visualize and handle data." – WRM Production Technologist at Daleel Petroleum

Frequently Asked Questions
All course bookings made through PEA are strictly non-refundable. By registering for a course, you acknowledge and accept that all fees are payable in full and are not subject to refund under any circumstances, including changes in personal or professional commitments or partial attendance.
PEA reserves the right to make reasonable adjustments to course content, trainers, or schedules where necessary, without entitling delegates to a refund. Comprehensive details of each course — including objectives, target audience, and content — are clearly outlined before enrolment, and it is the responsibility of the delegate to ensure the course's suitability prior to booking.
For any inquiries related to cancellations or bookings, please contact our support team, who will be happy to assist you.