| Code | Date | Time | Duration | Location | Currency | Team of 10 Per Person | Team of 7 Per Person | Early Bird Fee Per Person | Normal Fee Per Person |
|---|---|---|---|---|---|---|---|---|---|
| COURSE CODE : PEA / DAVP / DEC-24 | 17 Nov 2025 | 9 PM Indian Time |
2 Hours Per Day
|
Zoom Online
|
The Classes Will be Via Zoom Online from Monday to Friday.
Boost your team's skills and your budget! Enjoy group discounts for collaborative learning. Send an inquiry to info@peassociations.com.
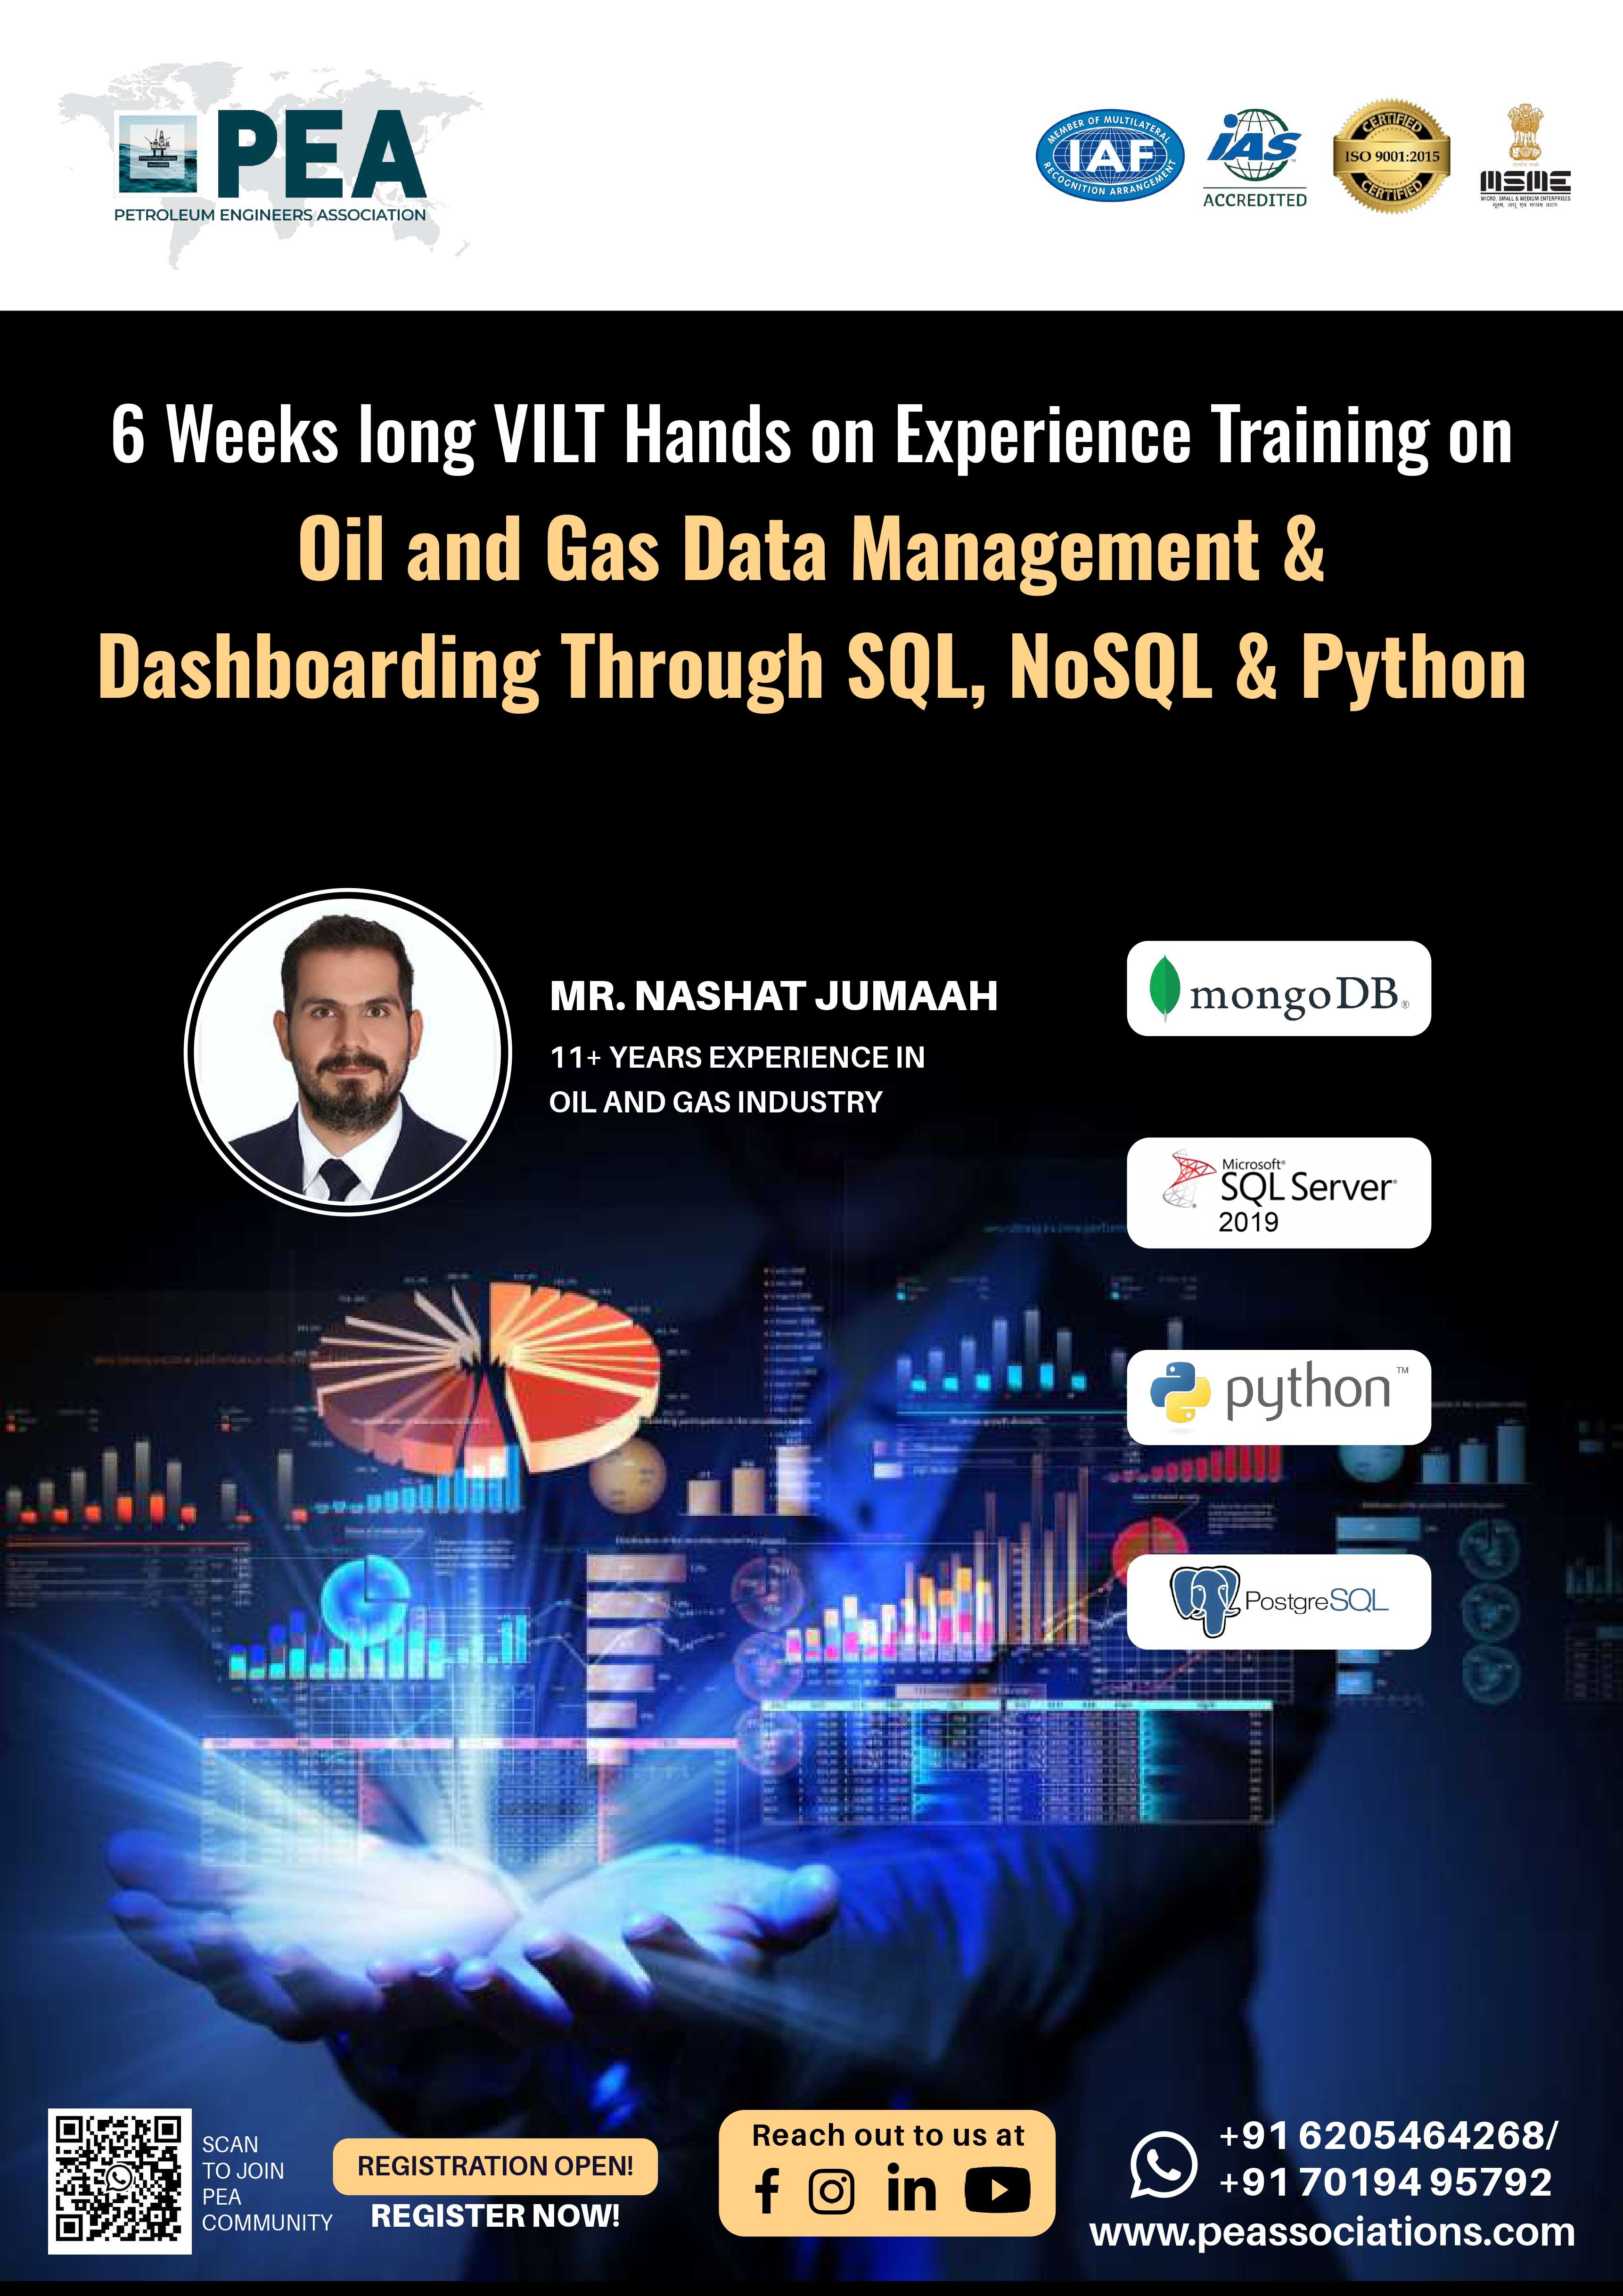
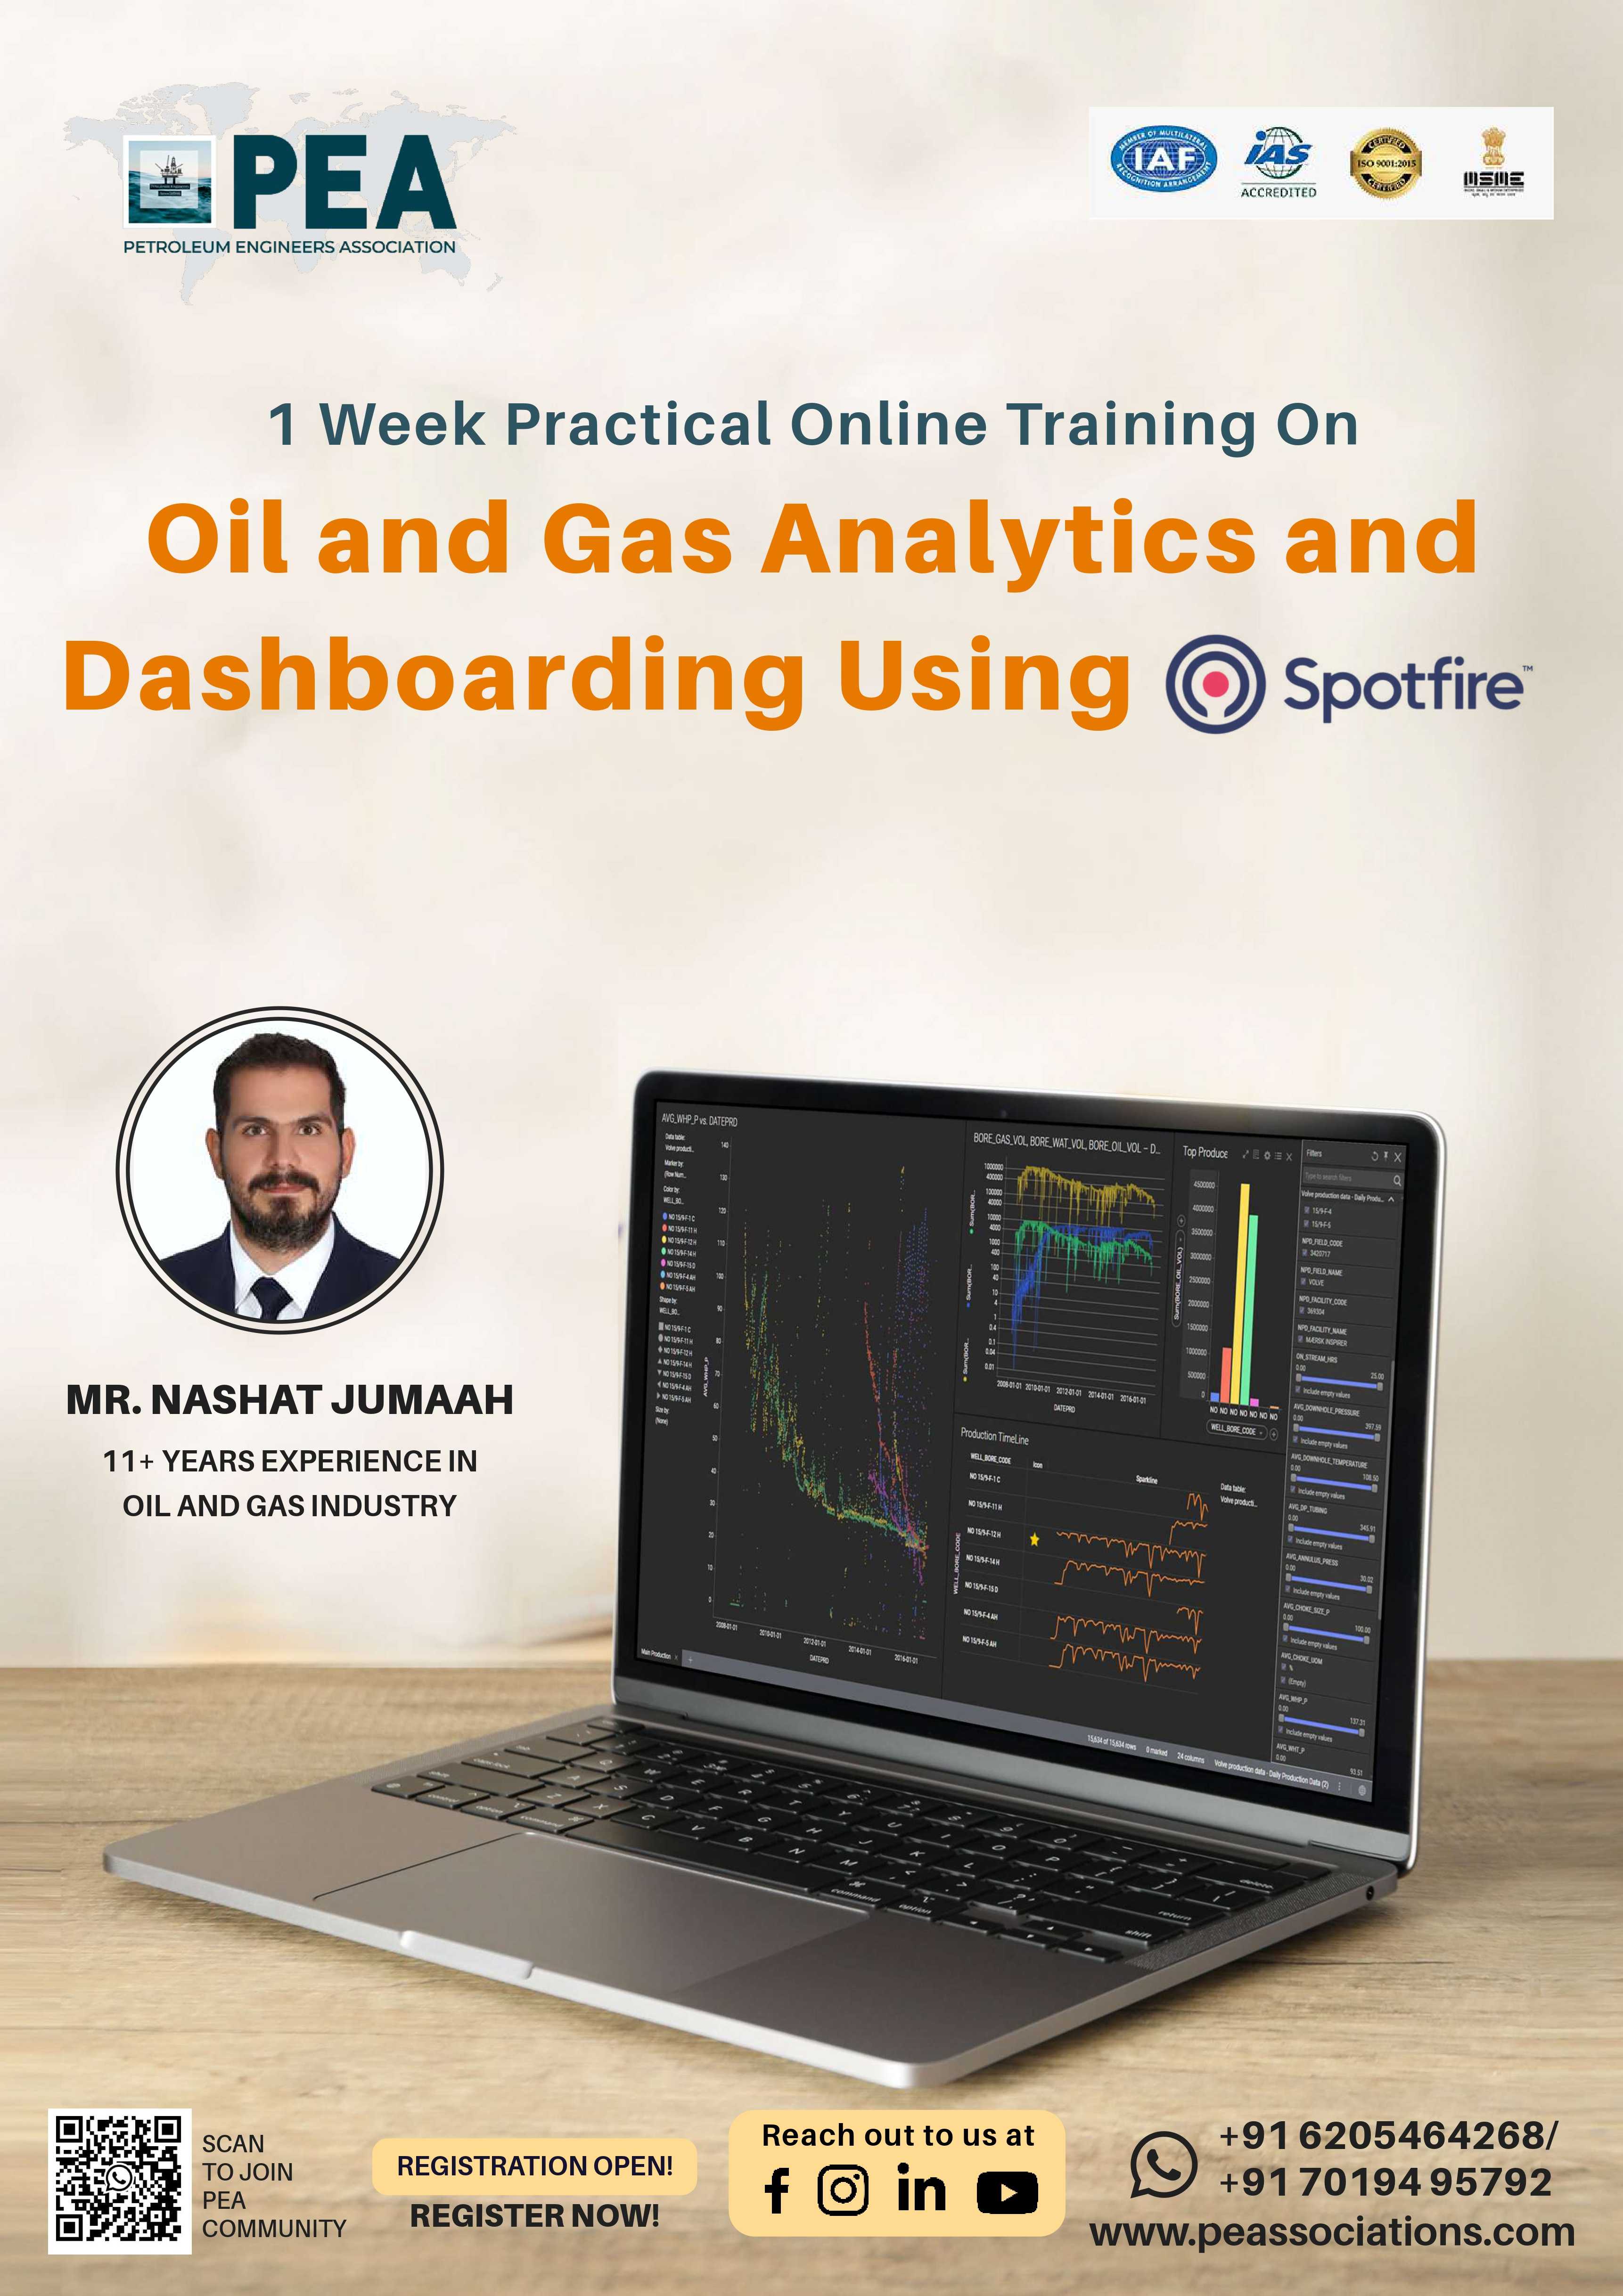
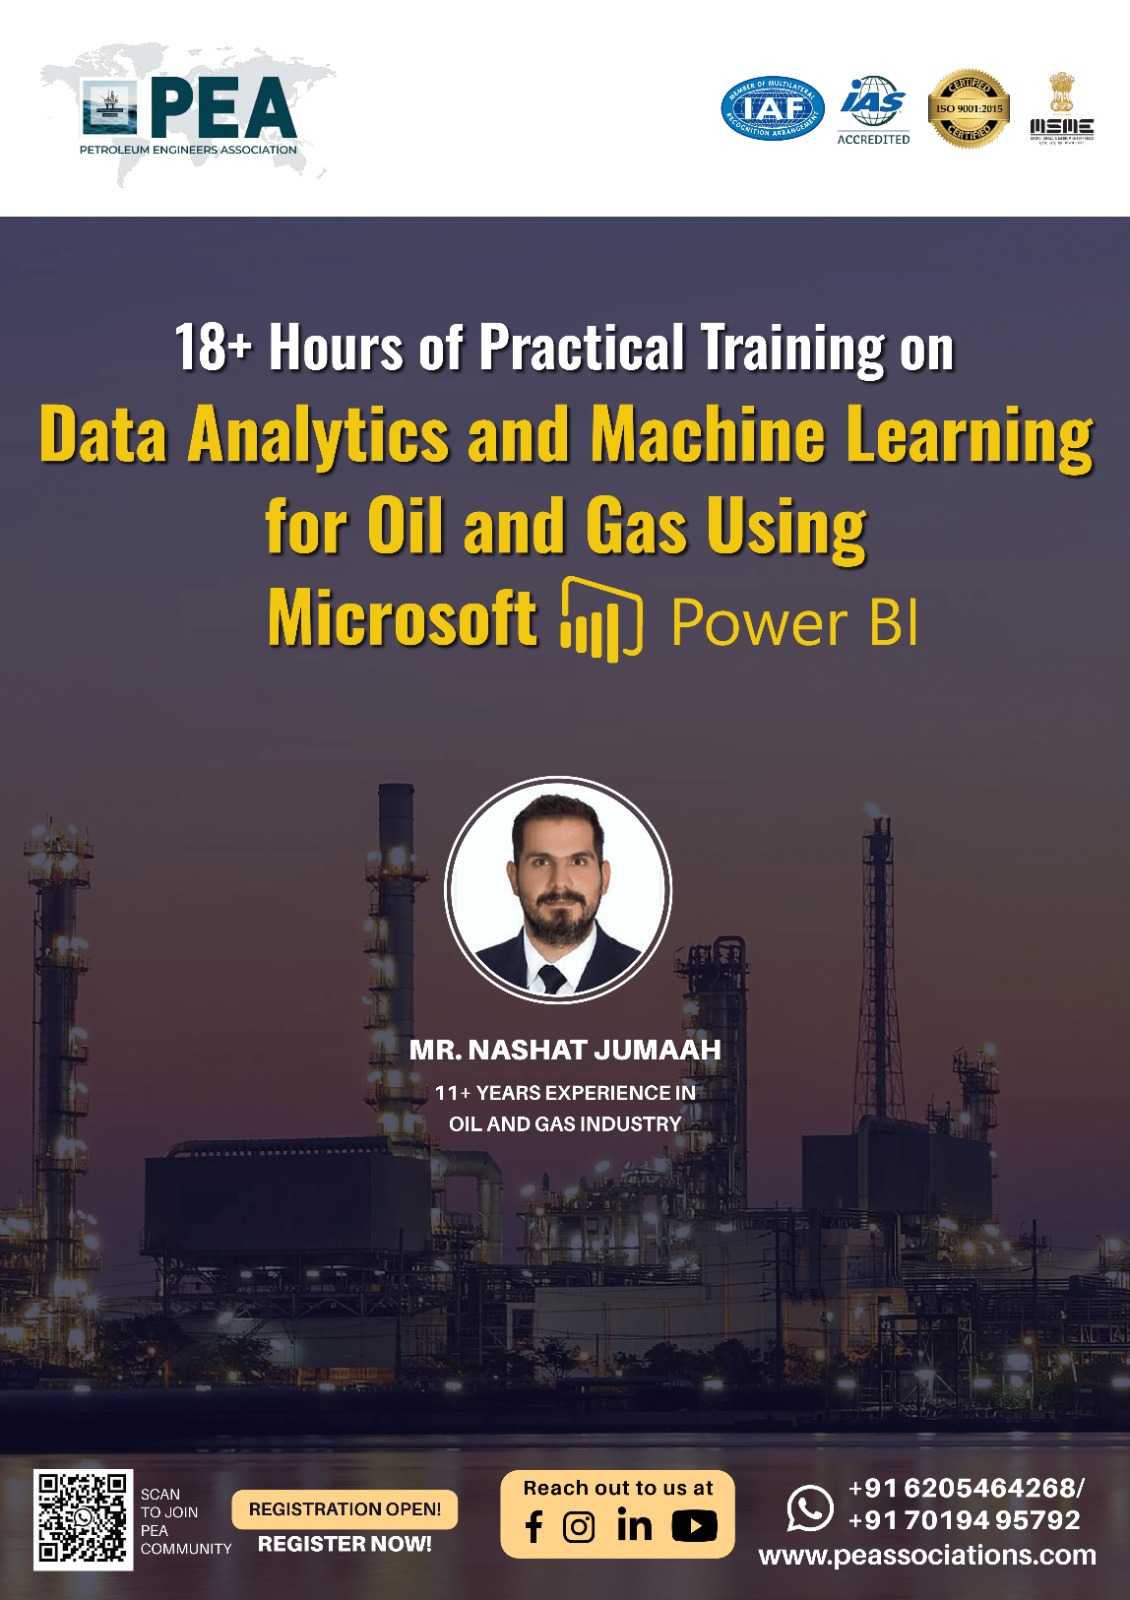
Data Analysis & Visualization For Oil & Gas Using Python, SQL , BI & Tableau
This course equips oil and gas professionals with essential skills in data analysis and visualization using Python, SQL, BI tools, and Tableau. Participants will learn to extract insights from complex data sets, optimize operations, and make informed decisions using industry-relevant workflows.
Description
The "Data Analysis & Visualization for Oil & Gas Using Python, SQL, BI & Tableau" course is designed to provide professionals in the oil and gas industry with comprehensive skills to handle large datasets and translate them into actionable insights. Participants will master the use of Python for data manipulation, SQL for database management, BI tools for operational reporting, and Tableau for data visualization. By the end of this course, you’ll be able to streamline operations, improve efficiency, and drive data-informed decisions in various aspects of the oil and gas sector.
Demo Class
The oil and gas industry generates vast amounts of data daily, and the ability to analyze, interpret, and visualize this data is critical for making strategic decisions. This course focuses on empowering professionals to harness data effectively using modern tools such as Python, SQL, BI, and Tableau. Whether you're in upstream or downstream operations, this training will enhance your analytical capabilities and help you present data in impactful ways.
The course is delivered through interactive lectures, hands-on exercises, case studies, and real-world applications. Participants will work on oil and gas datasets, enabling them to directly apply what they learn in a practical setting. Instructors will guide participants step-by-step through using Python, SQL, BI, and Tableau for data analysis and visualization.
By attending this course, your organization will benefit from enhanced decision-making capabilities. Employees will gain skills to interpret large volumes of data, streamline operational workflows, and uncover insights that lead to cost savings and efficiency improvements. This training equips your team with tools to handle modern data challenges and support the company’s digital transformation initiatives.
Participants will gain in-demand technical skills that boost their professional expertise in data analysis, programming, and visualization. You will be able to confidently manipulate and interpret data using Python and SQL, generate reports with BI tools, and create visually compelling dashboards with Tableau. These competencies will enhance your career prospects and enable you to add value to any oil and gas organization.
This course is ideal for:
- Data analysts, engineers, and professionals in the oil and gas industry.
- Reservoir, production, and drilling engineers looking to enhance their data-driven decision-making skills.
- Oil and gas professionals are involved in operations, planning, and optimization.
- Anyone looking to gain technical skills in data analysis and visualization specific to the oil and gas sector.
Module 1:
Introduction to Python
Introduction to the python ecosystem
Why Python and not other languages for Oil and Gas?
Industry wide projects done with python(from onepetro).
Introduction to data types
Introduction to arrays and lists
Introduction to loops and if conditions
Introduction to Pandas and Dataframes
Introduction to Data Visualization
Introduction To Streamlit Data Apps
Module 2:
Introduction To Databases
- Introduction to Data Containers
- Introduction to various DB technologies
- Basics of Data structures and unstructured data
- Introduction to CRUD Operations
- Retrieving data from databases
- Python connection with Databases.
- Introduction to database schemas and design aspects
Module 3:
Introduction to Business Analytics (PowerBI)
- Introduction to PowerBI
- PowerBI Working Environments.
- Introduction to Basics of PowerBI
- Basics of Data Loading and Data View
- Simple Plotting In PowerBI
- Basics of Data Modeling Theory
- Relationships between oil and gas data
- Working With Multisource data.
- Data Manipulation and Transformation.
- Advanced Data Loading.
- Data View and Calculated Columns
Module 4:
Introduction to Tableau Visualizations
- Introduction to Tableau
- Tableau Interface and workspace
- Introduction to tableau components(DataPane, Shelves, etc)
- Connecting to Data(Excel, CSV, DB)
- Building Interactive Visualizations.
- Introduction to Dashboarding
- Data manipulation and Custom calculation
- Introduction to Surface and Subsurface mapping
On successful completion of this training course, PEA Certificate will be awarded to the delegates

Mr. Nashat J. Omar With over 11 years of specialized experience in petroleum engineering, focus on production and flow assurance brings valuable expertise to the energy sector.
He possess a strong command of Python and C#, which empowers him to create efficient data management solutions and streamline workflows.
His collaborative nature and adaptability enable him to thrive in multidisciplinary settings, where he consistently contributes to success through innovative problem-solving.
He is dedicated to continuous learning and staying ahead of industry advancements, ensuring that he can enhance operational efficiency and guarantee robust flow assurance.

