Boost your team's skills and your budget! Enjoy group discounts for collaborative learning. Send an inquiry to info@peassociations.com.
Petrel Software Training
Description
Introduction to PETREL E&P
PETREL E&P is a powerful software platform widely used in the oil and gas industry for seismic interpretation, reservoir characterization, and geological modeling. It offers a comprehensive suite of tools and workflows to streamline exploration and production activities.
Plugins
PETREL's functionality can be expanded through plugins, which are additional software modules that provide specialized capabilities. These plugins cover a wide range of applications, such as advanced seismic processing, geomechanical modeling, and production forecasting.
Ocean Plugins Store
The Ocean Plugins Store is a centralized repository for PETREL plugins. It allows users to easily browse, download, and install plugins from various developers, enhancing the software's capabilities to meet specific project requirements.
Main Interface
PETREL's main interface provides a user-friendly environment for accessing different tools and workflows. It typically consists of a menu bar, toolbars, a project tree, and a 3D visualization window. The interface is designed to facilitate efficient data management and visualization.
Project CRS
The Project Coordinate Reference System (CRS) defines the coordinate system used for the project data. It ensures that all data is spatially referenced correctly, allowing for accurate integration and analysis.
Seismic folders
PETREL organizes seismic data within folders, making it easy to manage and access different seismic surveys and volumes. These folders can contain various seismic data types, such as 2D and 3D seismic surveys, velocity models, and attributes.
Data Management 1
Data management in PETREL involves importing, organizing, and quality-controlling data. It includes defining data types, setting up project directories, and ensuring data integrity. Efficient data management is crucial for successful project execution.
Project CRS 2
The Project CRS plays a critical role in ensuring accurate spatial referencing of data within the project. It is essential to define the appropriate CRS at the beginning of the project to avoid data misalignment issues.
Shape File Loading
Shape files, which contain vector data representing geological features or boundaries, can be loaded into PETREL to provide additional context for interpretation and modeling. These shape files can be used to define faults, horizons, or other geological elements.
Seismic Data Loading
Seismic data is loaded into PETREL for interpretation and analysis. This involves importing seismic surveys, velocity models, and other relevant data. The loaded seismic data forms the basis for subsurface visualization and interpretation.
Data Correlation
Data correlation involves establishing relationships between different data types, such as seismic data, well logs, and geological models. This helps integrate information from various sources and build a comprehensive understanding of the subsurface.
Data management 2
Data management continues throughout the project, ensuring data is organized, updated, and accessible. This includes managing seismic data, well logs, interpretations, and models. Effective data management streamlines workflows and facilitates collaboration.
Seismic Data Interpretation Techniques
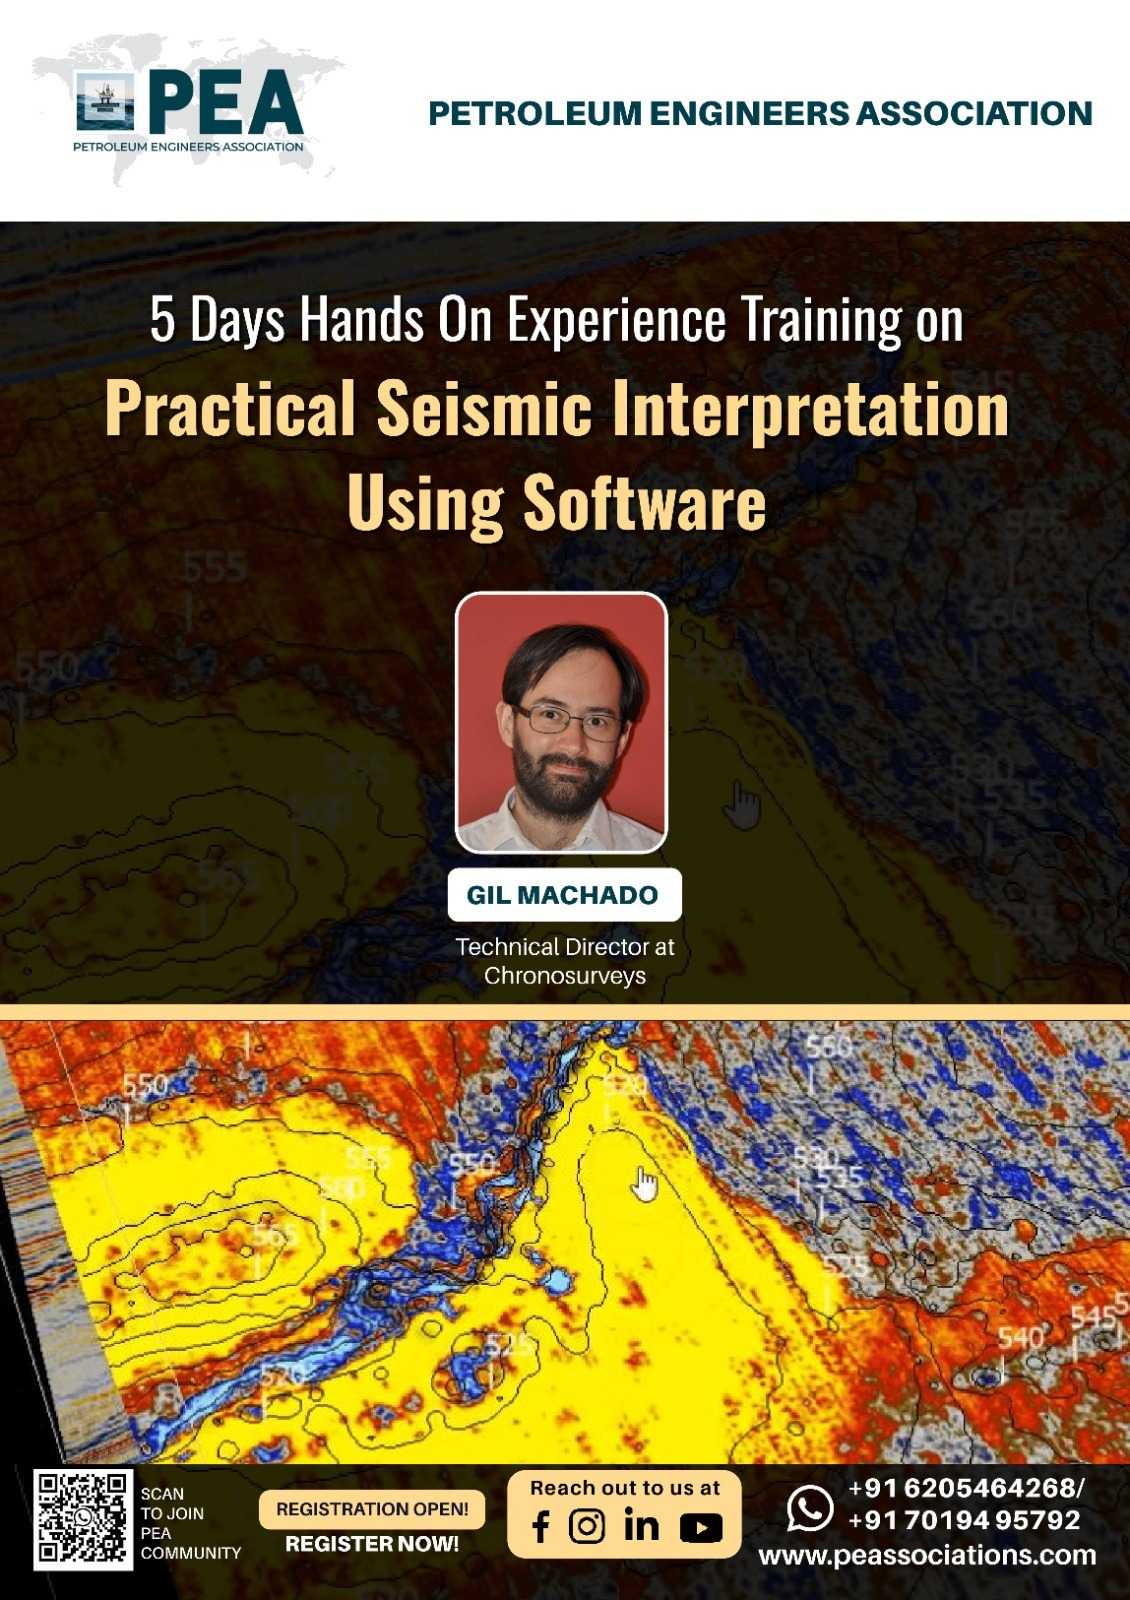
Seismic interpretation involves analyzing seismic data to identify and map subsurface geological structures and features. Various interpretation techniques are used, such as horizon tracking, fault interpretation, and attribute analysis.
Seismic Interpretation Plugins
PETREL offers a range of seismic interpretation plugins that provide advanced capabilities for horizon tracking, fault interpretation, and attribute analysis. These plugins can automate and enhance interpretation workflows, improving efficiency and accuracy.
Manual Interpretation illustration
Manual interpretation involves manually picking horizons, faults, and other geological features on seismic sections. This requires expertise and knowledge of geological principles and seismic interpretation techniques.
Auto Interpretation illustration
Auto interpretation utilizes algorithms and machine learning to automate the picking of horizons, faults, and other features. This can significantly speed up interpretation workflows, especially for large datasets.
Data Management 3
Data management remains crucial during seismic interpretation, ensuring interpretations are organized, stored, and easily accessible. This includes managing horizon interpretations, fault interpretations, and other interpretation results.
Workflow for Static Modeling 1
Static modeling involves building a 3D geological model of the subsurface based on seismic interpretations, well logs, and other data. This model represents the spatial distribution of rock properties and fluid saturations.
Fault Interpretation Techniques
Fault interpretation involves identifying and mapping faults on seismic data. Various techniques are used, such as identifying fault planes, fault intersections, and fault throws.
Manual Fault Interpretation
Manual fault interpretation involves manually picking faults on seismic sections. This requires careful analysis of seismic data and an understanding of fault geometries and seismic responses.
Fault Sticks and Geology Faults
Fault sticks are vertical lines representing the location of faults on seismic sections. Geology faults are 3D representations of faults within the geological model.
Faults Plane
Fault planes are surfaces representing the geometry of faults within the 3D geological model. These planes define the spatial extent and orientation of faults.
Faults correlation
Fault correlation involves establishing relationships between faults identified on different seismic sections or in different parts of the model. This helps build a consistent and accurate representation of the fault network.
Fault polygons and Fault Boundaries
Fault polygons are 2D representations of faults on maps or cross-sections. Fault boundaries define the limits of fault compartments within the geological model.
Data management 4
Data management continues during fault interpretation and model building, ensuring fault interpretations and models are organized and stored correctly. This includes managing fault sticks, fault planes, and other fault-related data.
Workflow for static modeling 2
The static modeling workflow involves integrating fault interpretations, horizon interpretations, and well data to build a 3D geological model. This model provides a framework for reservoir characterization and simulation.
Surface generation plugin
The surface generation plugin in PETREL allows for the creation of 3D surfaces representing horizons, faults, or other geological features. These surfaces form the basis for the geological model.
Reservoir map generation
Reservoir maps can be generated in PETREL to visualize the spatial distribution of reservoir properties, such as porosity, permeability, and fluid saturations. These maps aid in reservoir characterization and production planning.
Understanding of different errors
Understanding different types of errors, such as seismic acquisition errors, processing errors, and interpretation errors, is crucial for accurate geological modeling. Recognizing and mitigating these errors helps improve model reliability.
Fault polygons making
Fault polygons can be created in PETREL to represent faults on maps or cross-sections. These polygons help visualize the spatial extent and geometry of faults.
Theory of Fault Modeling w.r.t Structure Geology
Fault modeling involves incorporating faults into the geological model, considering their impact on the structural framework and fluid flow. Understanding the theory of fault modeling helps build geologically realistic models.
Data management 5
Data management remains important during model building and analysis, ensuring models, maps, and other results are organized and stored effectively. This facilitates data sharing and collaboration.
Workflow for static modeling 3
The static modeling workflow continues with the integration of reservoir properties and fluid saturations into the geological model. This creates a comprehensive representation of the subsurface.
Boundaries making
Boundaries define the limits of different geological units or compartments within the model. These boundaries can be based on faults, horizons, or other geological features.
Well logs loading
Well logs, which provide detailed information about subsurface rock properties and fluid saturations, can be loaded into PETREL for analysis and correlation. These logs are crucial for calibrating the geological model and understanding reservoir characteristics.
Well logs correlation
Well log correlation involves establishing relationships between well logs from different wells. This helps identify and map subsurface geological units and correlate reservoir properties across the field.
Well section window
The well section window in PETREL displays well logs and interpretations along a vertical or deviated well path. This allows for detailed analysis of subsurface properties and correlation with seismic data.
Well tops loading
Well tops represent the depths or elevations at which different geological units or formations are encountered in a well. Loading well tops into PETREL helps define the stratigraphic framework of the model.
Well header loading
Well headers contain information about the well, such as its location, coordinates, and drilling history. Loading well headers into PETREL provides context for well data and facilitates data management.

