


Can a Dashboard Tell the Story of an Entire Oil Field?
Picture this: you are sitting in a morning operations meeting. The drilling superintendent is discussing rig performance, the reservoir engineer is reviewing water injection rates, and the production manager is worried about declining well output.
Traditionally, this would mean flipping through endless Excel sheets, static PDFs, and siloed reports.
But now imagine opening one Power BI dashboard where:
✅ Declining wells are highlighted in red.
✅ Injection vs. production maps show water breakthrough risks.
✅ Operator KPIs and costs are updated in real-time from SQL databases.
✅ Satellite heat maps display field-wide production efficiency.
That’s not a dream. That’s Power BI in Oil & Gas.
Why Power BI Matters in Oil & Gas
Power BI is more than a visualization tool it’s a decision-making accelerator. In an industry where time = money and delays cost millions, it helps professionals:
Unify Data Sources – Integrate drilling logs, SCADA, production databases, and ERP systems into one view.
Spot Patterns Early – Detect production decline, abnormal pressure behavior, or equipment downtime trends before they escalate.
Optimize Field Development – Track well performance across reservoirs and operators for better planning.
Enhance Collaboration – Give engineers, managers, and executives the same dashboard with insights tailored to their needs.
Drive Faster Decisions – Turn raw data into stories that inspire action, not confusion.
Practical Applications in Oil & Gas
Here are some real-world scenarios where Power BI makes an impact:
Well Performance Monitoring: Compare actual vs. planned production rates across wells and instantly flag underperformers.
Reservoir Management: Map injection vs. production balance to improve waterflood recovery.
Operational Efficiency: Track drilling NPT (Non-Productive Time) trends and optimize rig scheduling.
Cost & Economics: Visualize CAPEX, OPEX, and breakeven analysis for field development.
HSE Compliance: Monitor safety KPIs, incidents, and corrective actions across multiple assets.
🔑 The Big Benefit
Power BI empowers oil & gas professionals to move away from reactive firefighting to proactive decision-making. Instead of waiting for end-of-month reports, you get live insights that drive field performance, reduce costs, and enhance safety.
If data is the new oil, then Power BI is the refinery that transforms it into usable fuel for smarter operations.
Related Blogs:
- Technical Topics
- 9th October, 2025
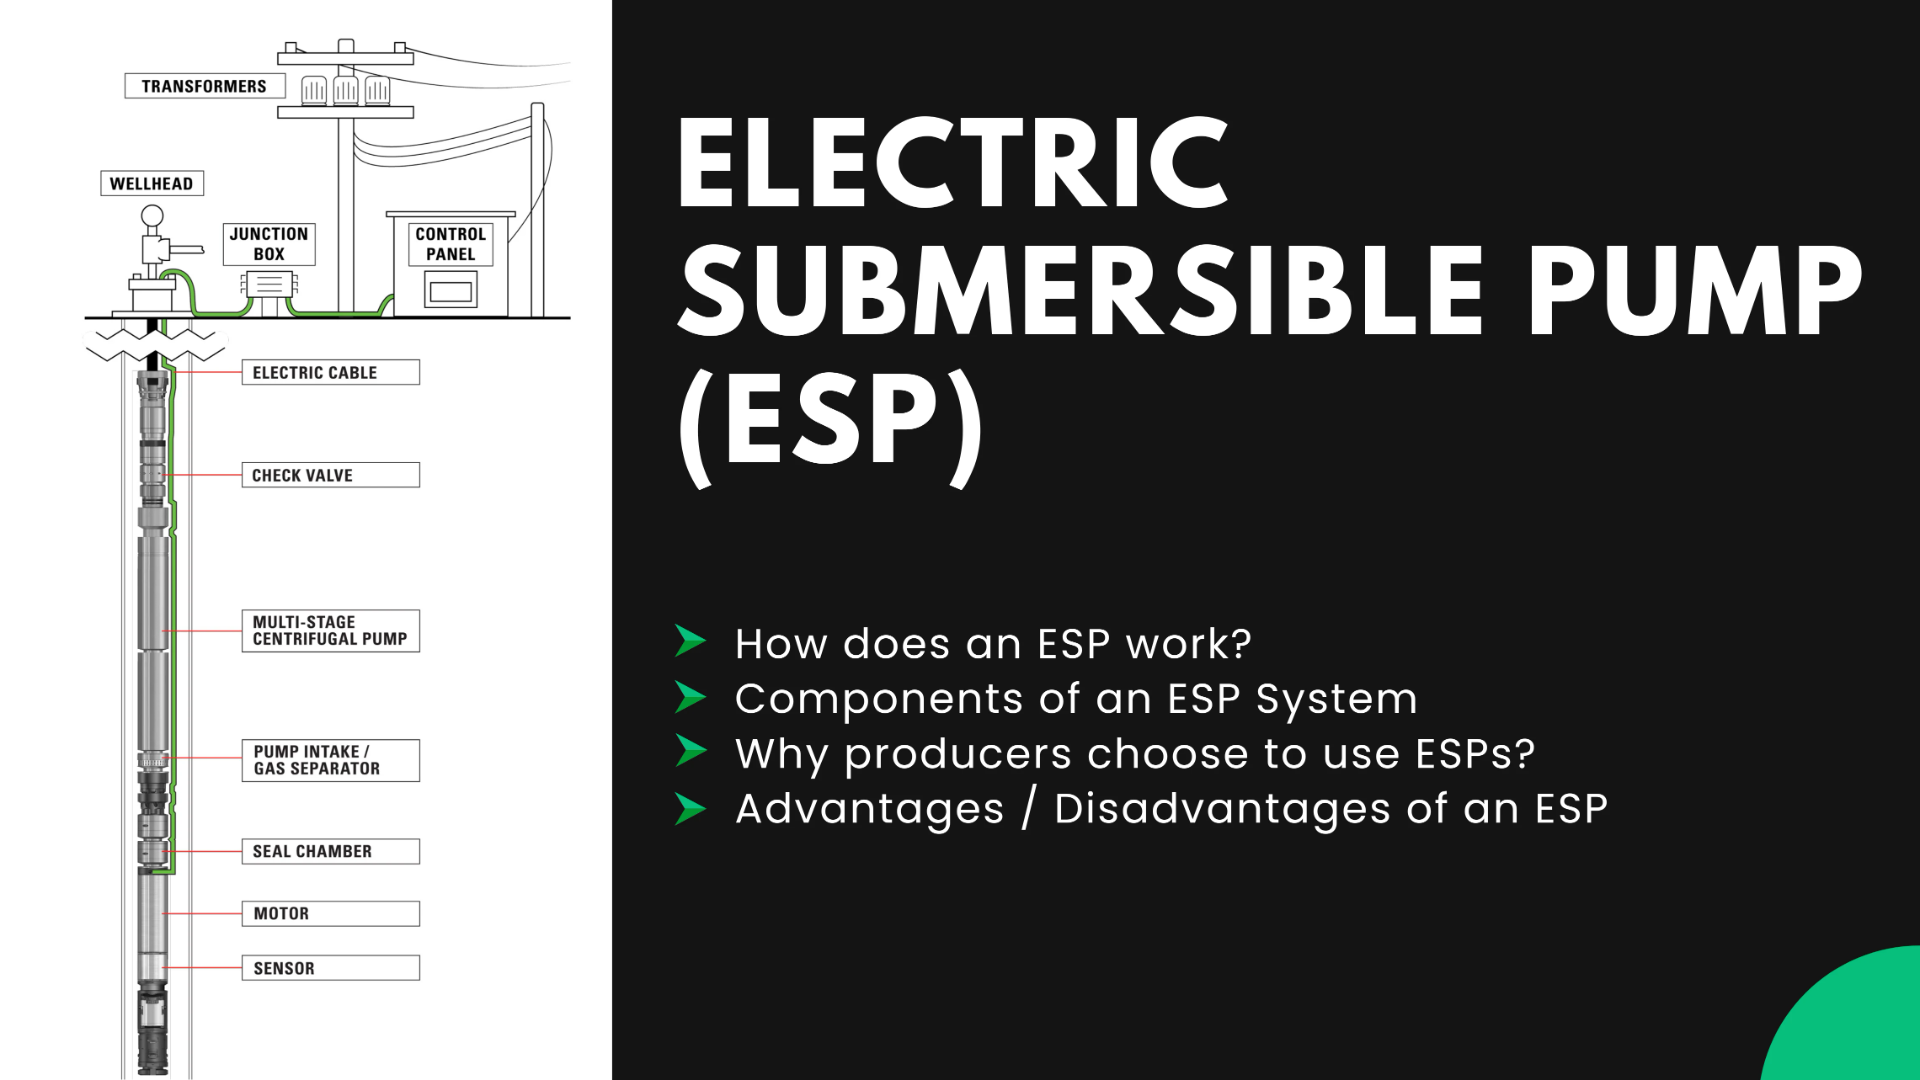
Things you must know about ESP
What is an electric submersible pump?ESP is a form of artificial lift that uses an el...

- Technical Topics
- 7th October, 2025
Oil and Gas Wellsite Safety
12 Steps for Oil and Gas Wellsite Safety1. Watch for Cattle and Other AnimalsWhen you...
- Technical Topics
- 6th October, 2025
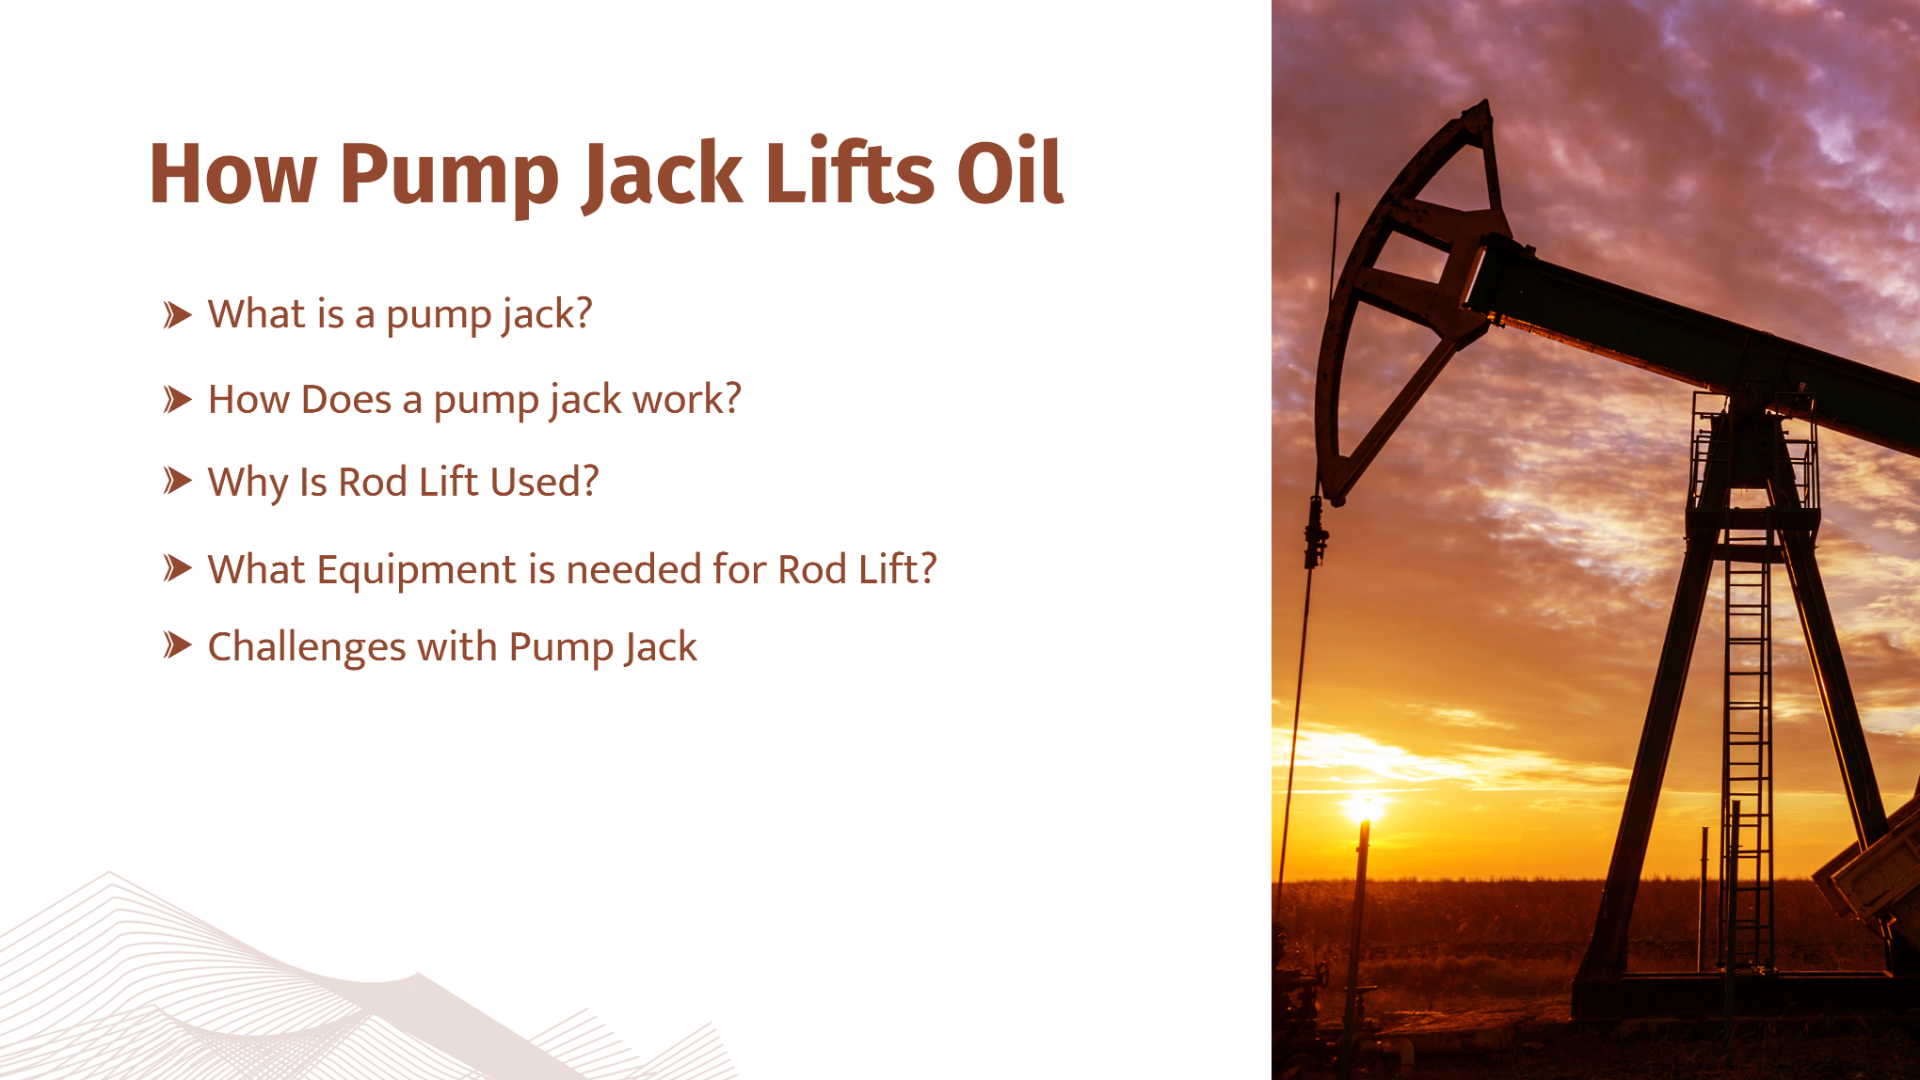
How Pump Jack Lifts Oil
What is a pump jack?A pump jack is a widely recognized piece of equipment used to pum...
Leave a comment on this Blog/Article.