
Oil and Gas Data Management and Dashboarding using SQL, NoSQL, Power BI and Python
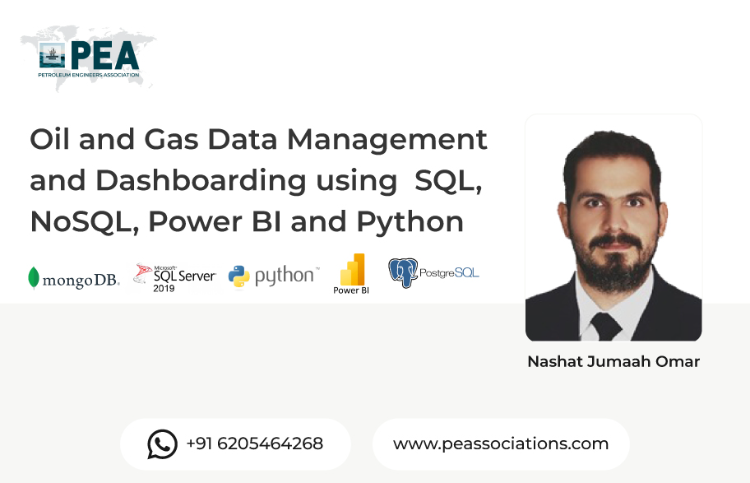
This 2-day intensive workshop is designed for the oil and gas industry, focusing on transforming operations with data management and real-time visualization tools. Participants will learn practical workflows for managing, querying, and visualizing oilfield data using SQL, NoSQL, Power BI, and Python. The course features hands-on demonstrations and real-world examples to build data pipelines, connect databases, and design dashboards tailored for engineering and operational excellence in oil & gas.
Workshop Objectives
Introduce data storage concepts and the data landscape in oil and gas operations
Teach the fundamentals of relational databases and working with SQL for production data
Demonstrate data querying, filtering, aggregation, and joins for field-level insight
Enable participants to build Power BI dashboards backed by SQL databases
Integrate multiple data sources using Power BI and Python for automated reporting
Create dashboards and visualizations in Power BI, Matplotlib, and Plotly
Guide the design of intuitive, engineer-friendly dashboards and data analytics workflows
About the Presenter
Nashat Jumaah Omar - 12+Years of Experience In Oil & Gas Industry
Register Now
View More


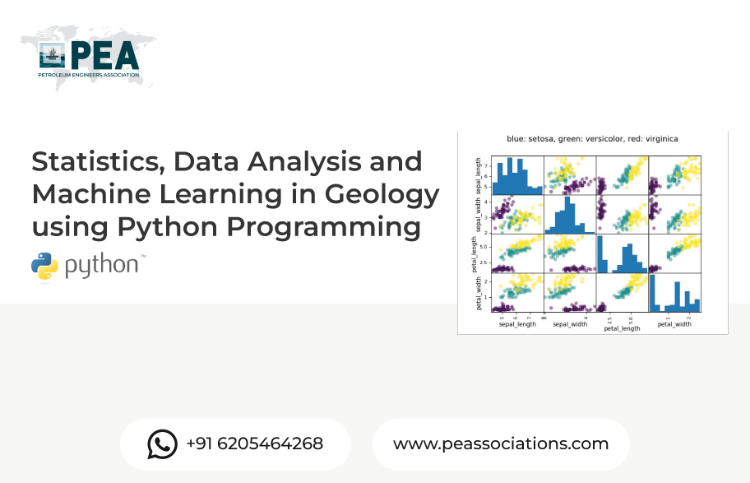
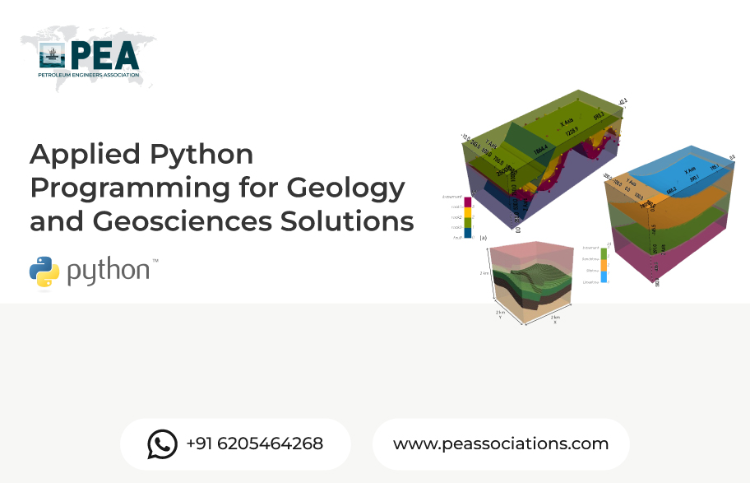


Applied Python for Oil and Gas Industry
This intensive three-day workshop equips oil and gas professionals with hands-on Python programming skills for industry applications. Participants learn why Python is becoming the future tool for oilfield workflows due to its unmatched flexibility and versatility. The training covers Python fundamentals, data analysis, visualization, and automation relevant to reservoir, production, drilling, and subsurface engineering, using practical workflows and real datasets. No prior Python experience is required, though oil & gas industry knowledge is helpful.