
Leverage Python to Solve Complex Geological Challenges
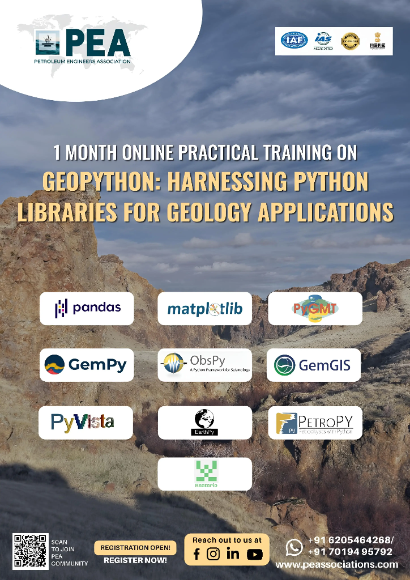
Geopython: Harnessing Python Libraries for Geology Applications
Master the use of Python libraries to streamline geological data analysis, visualization, and decision-making.


Geopython: Harnessing Python Libraries for Geology Applications
Have Questions ?
Geopython: Harnessing Python Libraries for Geology Applications -
Boost your team's skills and your budget! Enjoy group discounts for collaborative learning. Send an inquiry to info@peassociations.com.
Geopython: Harnessing Python Libraries for Geology Applications
This course introduces participants to the power of Python programming in geology. It focuses on practical applications of Python libraries to analyze, visualize, and interpret geological data, enabling professionals to work more efficiently and accurately.
Description
With the growing complexity of geological data, traditional tools often fall short in delivering the speed and depth of analysis required. Python, with its wide range of scientific and visualization libraries, has become an essential tool for geoscientists.
This course equips participants with the skills to apply Python in solving real-world geology problems. From handling large datasets to creating insightful visualizations and running advanced analyses, participants will gain hands-on experience in leveraging Python’s capabilities. The program emphasizes practical exercises, ensuring participants can directly apply what they learn in their professional roles.
This intensive 4-week online practical training program is designed to equip geology professionals with essential Python programming skills for modern geological applications. The course covers 10 specialized Python libraries used in geology, geophysics, and earth sciences through simplified, beginner-friendly projects and real-world applications
By the end of this course, participants will be able to:
-
Understand the role of Python in geology and geoscience applications.
-
Use key Python libraries (NumPy, Pandas, Matplotlib, SciPy, etc.) for geological data analysis.
-
Visualize geological datasets through advanced plotting and mapping techniques.
-
Automate workflows to improve efficiency and accuracy.
-
Apply Python-based solutions to support exploration and subsurface decision-making.
The course is delivered through a combination of interactive lectures, hands-on coding exercises, case studies, and practical assignments. Participants will work with real geological datasets to apply Python libraries in practical scenarios.
Improved efficiency in handling and analyzing geological data.
-
Enhanced accuracy in subsurface evaluation and exploration workflows.
-
Reduced reliance on manual and repetitive tasks.
-
Stronger decision-making through data-driven geological insights.
-
Increased technical capability within geoscience teams.
Ability to apply Python programming to geology-specific challenges.
Hands-on skills in using Python libraries for data analysis and visualization.
Improved problem-solving and technical efficiency.
Enhanced career opportunities through expertise in digital geoscience.
Confidence in applying modern tools to traditional geology workflows.
This course is designed for:
-
Geologists and Geoscientists
-
Reservoir Engineers and Subsurface Professionals
-
Exploration and Production Teams
-
Data Scientists working with geological datasets
-
Technical Professionals seeking to integrate programming with geoscience applications
Day 1: Pandas for Geological Data Analysis
-
Topics Covered
-
Loading small CSV files (10–20 rows of data)
-
Basic data inspection commands
-
Simple calculations and averages
-
Sorting and filtering geological data
-
Creating basic summary tables
-
-
Simplified Projects
-
Project A: Rock Sample Database
-
Work with 20 rock samples and their properties
-
Calculate average density, hardness, and porosity
-
Find the heaviest and lightest samples
-
Create a simple summary table
-
-
Project B: Monthly Rainfall Analysis
-
Analyze 12 months of rainfall data for a location
-
Calculate total, average, and maximum rainfall
-
Identify wet and dry seasons
-
Create monthly comparison tables
-
-
Day 2: Matplotlib for Geological Visualization
-
Topics Covered
-
Basic line plots and bar charts
-
Scatter plots for geological relationships
-
Simple pie charts for composition data
-
Adding titles, labels, and legends
-
Choosing appropriate colors for geology
-
-
Simplified Projects
-
Project A: Rock Type Distribution Chart
-
Create a pie chart showing 5 different rock types
-
Make a bar chart of mineral percentages
-
Add proper labels and colors
-
Save the plots as image files
-
-
Project B: Temperature vs Depth Plot
-
Plot temperature readings at different depths (10 data points)
-
Create a simple line graph
-
Add axis labels and title
-
Mark the maximum temperature point
-
-
Day 3: Rasterio for Geospatial Raster Data
-
Topics Covered
-
Opening elevation data files
-
Reading raster properties and metadata
-
Extracting elevation values at points
-
Creating simple elevation profiles
-
Basic coordinate system concepts
-
-
Simplified Projects
-
Project A: Elevation Profile Creator
-
Load a small elevation raster (provided)
-
Extract elevation along a straight line
-
Create a simple elevation profile plot
-
Find the highest and lowest points
-
-
Project B: Basic Raster Information
-
Open a satellite image file
-
Display basic properties (size, bands, coordinates)
-
Extract pixel values at 5 different locations
-
Create a simple information report
-
-
Day 4: ObsPy for Seismological Data
-
Topics Covered
-
Loading earthquake catalog data
-
Basic earthquake data structure
-
Simple magnitude and location analysis
-
Creating earthquake timeline plots
-
Understanding earthquake frequency
-
-
Simplified Projects
-
Project A: Earthquake Timeline
-
Plot 50 earthquakes over time
-
Create a simple timeline chart
-
Identify the largest earthquake
-
Count earthquakes by month
-
-
Project B: Earthquake Location Map
-
Plot earthquake locations on a simple map
-
Use different colors for different magnitudes
-
Add labels for major earthquakes
-
Calculate the average magnitude
-
-
Day 5: EarthPy for Remote Sensing Applications
-
Topics Covered
-
Loading Landsat image bands
-
Creating simple color combinations
-
Basic vegetation index calculation (NDVI)
-
Displaying satellite images
-
Understanding satellite band combinations
-
-
Simplified Projects
-
Project A: Vegetation Health Assessment
-
Calculate NDVI for a small area (100×100 pixels)
-
Create a simple vegetation map
-
Find areas with healthy vegetation
-
Generate a basic vegetation report
-
-
Project B: Satellite Image Display
-
Load 3 satellite bands (Red, Green, Blue)
-
Create a true-color image
-
Create a false-color image
-
Compare the two images side by side
-
-
Day 6: PyGMT for Geospatial Mapping
-
Topics Covered
-
Basic map projections
-
Simple topographic mapping
-
Adding points and lines to maps
-
Basic geological symbols
-
Map legends and scale bars
-
-
Simplified Projects
-
Project A: Study Area Map
-
Create a simple topographic base map
-
Add 10 sample locations as points
-
Include a north arrow and scale bar
-
Add a simple title and legend
-
-
Project B: Geological Points Map
-
Plot 15 geological observation points
-
Use different symbols for different rock types
-
Add a simple legend
-
Include coordinate grid lines
-
-
Day 7: GemPy for 3D Geological Modeling
-
Topics Covered
-
Simple 3-layer geological model
-
Basic model setup and parameters
-
Creating geological cross-sections
-
Understanding 3D geological visualization
-
Basic structural concepts
-
-
Simplified Projects
-
Project A: Three-Layer Model
-
Create a simple 3-layer cake model
-
Generate 2 cross-sections
-
Calculate layer thicknesses
-
Export model views as images
-
-
Project B: Simple Fold Model
-
Build a basic folded layer model
-
Create one geological cross-section
-
Identify fold axis location
-
Generate 3D visualization
-
-
Day 8: GemGIS for GIS Data Processing
-
Topics Covered
-
Loading simple shape files
-
Basic point and line data handling
-
Coordinate transformation basics
-
Simple spatial calculations
-
Data export and import
-
-
Simplified Projects
-
Project A: Sample Location Database
-
Create database of 25 sample locations
-
Add basic geological information
-
Calculate distances between points
-
Export to standard formats
-
-
Project B: Geological Boundary Digitization
-
Digitize 3 simple geological boundaries
-
Calculate boundary lengths
-
Create attribute table
-
Generate basic geological map
-
-
Day 9: PyVista for 3D Visualization
-
Topics Covered
-
Basic 3D plotting concepts
-
Simple mesh creation
-
Interactive 3D viewing
-
Color mapping and legends
-
Exporting 3D visualizations
-
-
Simplified Projects
-
Project A: 3D Sample Locations
-
Plot 30 samples in 3D space
-
Color-code by rock type
-
Add interactive rotation
-
Export high-quality image
-
-
Project B: Simple 3D Surface
-
Create basic topographic surface
-
Add elevation color mapping
-
Generate different viewing angles
-
Create simple fly-through animation
-
-
Day 10: PetroPY for Petrophysical Analysis
-
Topics Covered
-
Simple well log data handling
-
Basic porosity calculations
-
Clay content estimation
-
Well log curve plotting
-
Formation top identification
-
-
Simplified Projects
-
Project A: Single Well Analysis
-
Analyze one well with 3 log curves
-
Calculate average porosity for 2 formations
-
Create simple well log plot
-
Identify best reservoir interval
-
-
Project B: Formation Comparison
-
Compare properties of 2 formations
-
Calculate formation averages
-
Create comparison charts
-
Generate basic evaluation report
-
-
Day 11: Multi-Library Integration Project
-
Topics Covered
-
Simple workflow design
-
Data passing between libraries
-
Basic automation concepts
-
Error handling basics
-
Creating reusable scripts
-
-
Simplified Projects
-
Project A: Integrated Sample Analysis
-
Use pandas + matplotlib for sample data
-
Load 20 samples and create 3 plots
-
Calculate basic statistics
-
Generate automated report
-
-
Project B: Map + Data Integration
-
Combine PyGMT mapping with pandas data
-
Create map with 15 data points
-
Add simple data visualization
-
Export integrated results
-
-
Day 12: Capstone Projects and Course Review
-
Simplified Projects
-
Option A: Basic Geological Site Assessment
-
Analyze simple geological dataset (30 samples)
-
Create 5 basic visualizations
-
Use 3 different Python libraries
-
Generate 2-page summary report
-
-
Option B: Simple Well Data Analysis
-
Process data from 3 wells
-
Create basic well comparison plots
-
Calculate simple formation properties
-
Produce basic evaluation report
-
-
Option C: Basic Mapping Project
-
Create geological map with 20 sample points
-
Add simple geological information
-
Generate basic cross-section
-
Produce map layout with legend
-
-
On successful completion of this training course, PEA Certificate will be awarded to the delegates.
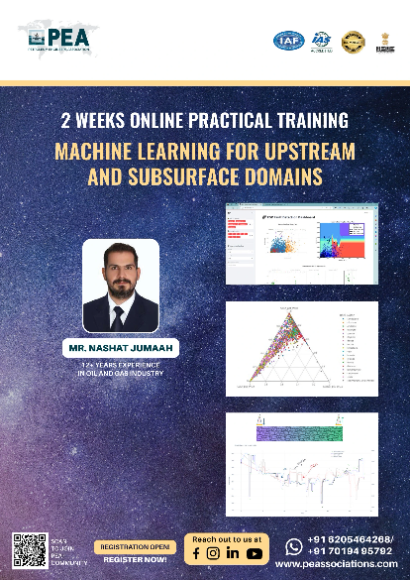
Mr. Nashat J. Omar With over 12+ years of specialized experience in petroleum engineering, focus on production and flow assurance brings valuable expertise to the energy sector.
He possess a strong command of Python and C#, which empowers him to create efficient data management solutions and streamline workflows.
Frequently Asked Questions
All course bookings made through PEA are strictly non-refundable. By registering for a course, you acknowledge and accept that all fees are payable in full and are not subject to refund under any circumstances, including changes in personal or professional commitments or partial attendance.
PEA reserves the right to make reasonable adjustments to course content, trainers, or schedules where necessary, without entitling delegates to a refund. Comprehensive details of each course — including objectives, target audience, and content — are clearly outlined before enrolment, and it is the responsibility of the delegate to ensure the course's suitability prior to booking.
For any inquiries related to cancellations or bookings, please contact our support team, who will be happy to assist you.
You may also be interested in...