
Oil and Gas Data Management and Dashboarding using SQL, NoSQL, Power BI and Python
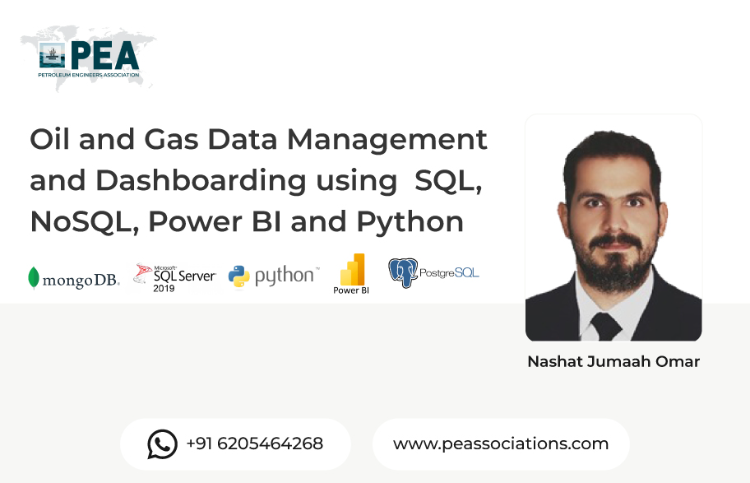
This 2-day intensive workshop is designed for the oil and gas industry, focusing on transforming operations with data management and real-time visualization tools. Participants will learn practical workflows for managing, querying, and visualizing oilfield data using SQL, NoSQL, Power BI, and Python. The course features hands-on demonstrations and real-world examples to build data pipelines, connect databases, and design dashboards tailored for engineering and operational excellence in oil & gas.
Workshop Objectives
Introduce data storage concepts and the data landscape in oil and gas operations
Teach the fundamentals of relational databases and working with SQL for production data
Demonstrate data querying, filtering, aggregation, and joins for field-level insight
Enable participants to build Power BI dashboards backed by SQL databases
Integrate multiple data sources using Power BI and Python for automated reporting
Create dashboards and visualizations in Power BI, Matplotlib, and Plotly
Guide the design of intuitive, engineer-friendly dashboards and data analytics workflows
About the Presenter
Nashat Jumaah Omar - 12+Years of Experience In Oil & Gas Industry
Register Now
View More


The role of multiphase flow modeling in the future of energy mix and reducing carbon footprint
Join Our Free Live Workshop: Exploring the Future of Energy Mix and Reducing Carbon Footprint through Multiphase Flow ModelingWe invite you to be a part of our exclusive live workshop dedicated to unraveling the pivotal role of multiphase flow modeling in shaping the future of our energy landscape and curbing carbon emissions. In this engaging session, industry experts, scientists, and visionaries will come together to share profound insights, innovative solutions, and practical approaches that can pave the way towards a more sustainable and eco-friendly future.